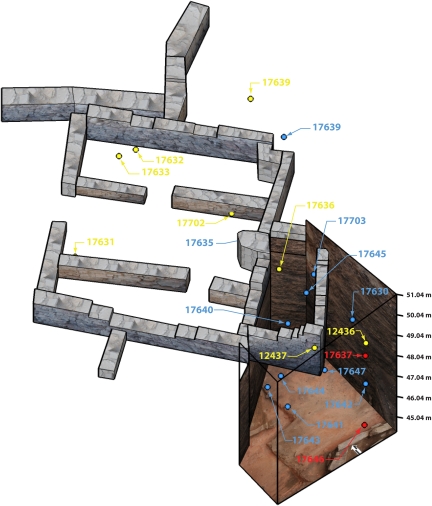
Fig. 3.
3-D visualization model of Area M 4-room building, excavation unit through slag mound and stratigraphic location of radiocarbon dates, KEN, Jordan. Numbers represent Oxford (OxA) laboratory numbers listed in Table 1. Blue spheres, 10th c. BCE; yellow, 9th c. BCE; red, outliers. Scale in meters above sea level shown on right side of model.

