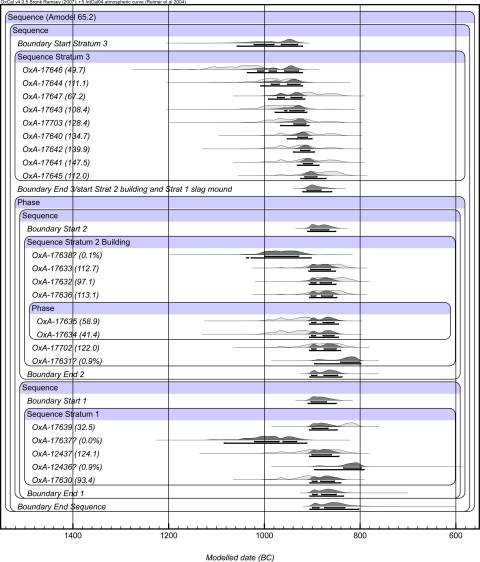
Fig. 4.
Probability distributions for dates obtained using the Bayesian model derived by using the archaeological prior information shown in Fig. S3. The distributions shown in gray outlines represent the simple calibrated radiocarbon ages, whereas the dark black distributions represent the posterior probability distributions determined via the modeling. This figure was generated by using OxCal 4.0 (30).

