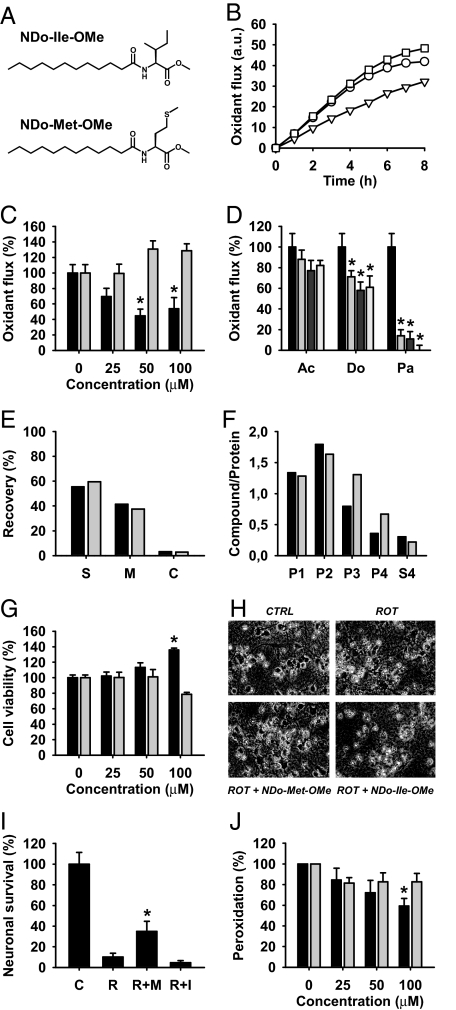
Fig. 4.
Antioxidant and cytoprotective effects of intramembrane methionyl accumulation. (A) Chemical structures of 2 model compounds used to mimic the cellular effect of the AUA codon reassignment in mitochondria. The 2 structures are N-dodecanoyl methionine methyl ester (NDo-Met-OMe) and N-dodecanoyl isoleucine methyl ester (NDo-Ile-OMe). (B) Metabolic oxidant flux in respiring SH-SY5Y neuroblastoma cells as measured by the temporal increase in cellular DCF fluorescence. Treatments were vehicle (circles), 50 μM NDo-Ile-OMe (squares), and 50 μM NDo-Met-OMe (triangles). (C) Induced oxidant flux in SH-SY5Y cells after addition of hydrogen peroxide (H2O2; 500 μM). Shown are normalized increases in cellular DCFA fluorescence 1 h after application of the peroxide. Black bars represent NDo-Met-OMe, gray bars represent NDo-Ile-OMe. (D) Comparison of N-acylated methionine derivatives as oxidant quenchers in SH-SY5Y cells. Experiments were done as in C; measurements were done after 3 h of incubation with H2O2. Ac is N-acetyl methionine methyl ester, Do is N-dodecanoyl methionine methyl ester, Pa is N-palmitoyl methionine. Each stack of bars represents concentrations of 0, 25, 50, 100 μM of the corresponding compound from left to right. (E) Cell permeability and membrane accumulation of NDo-Met-OMe (black bars) and NDo-Ile-OMe (gray bars), analyzed by HPLC with fluorescence detection. SH-SY5Y cells were treated with both compounds (100 μM) as in C, after which the different compartments were separated by centrifugation. (S) supernatant (incubation medium); M, membrane fraction; C, cytosolic fraction. Data are presented as relative recovery of each applied compound. (F) Subcellular distribution of NDo-Met-OMe (black bars) and NDo-Ile-OMe (gray bars) in SH-SY5Y cells. Organelle-enriched fractions were prepared after 1-h incubation (100 μM concentration) as in C. P1, nuclear fraction; P2, mitochondrial fraction; P3, Golgi fraction; P4, endoplasmic reticulum fraction; S4, cytosolic fraction. (G) Primary mesencephalic cell culture survival under hyperoxic culture conditions (20% oxygen). Metabolic MTT reduction was measured in mature cultures after a differential incubation with NDo-Met-OMe vs. NDo-Ile-OMe for 3 d. (H) Micrographs of primary mesencephalic cells incubated with rotenone (50 nM) and the indicated amino acid derivatives (100 μM) for 3 d. (I) The same experiment as in H, quantified by microscopic evaluation of neuronal survival. (J) Lipid peroxidation in rat liver mitochondria (1 mg/ml protein), induced by 10-min incubation with 200 μM Fe2+/100 μM H2O2. Mitochondria were preincubated with the compounds to be tested for 30 min. TBARS formation was measured by fluorimetric assay. Black bars represent NDo-Met-OMe, gray bars represent NDo-Ile-OMe. Numeric results are given as mean ± standard deviation. Asterisks denote significantly decreased oxidant flux (C and D), significantly increased cellular survival (G and I), or significantly decreased lipid peroxidation (J) as compared with the control (n ≥ 3; P < 0.01 by ANOVA with Student–Newman–Keul's test).

