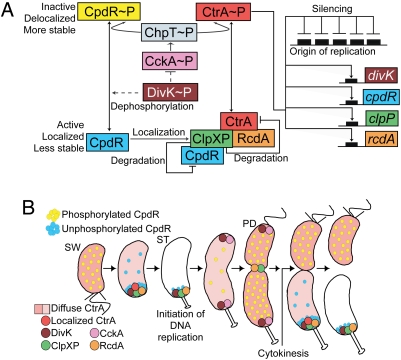
Fig. 1.
Model for CpdR and CtrA regulation (A) and cell cycle progression (B). (A) Continuous and dashed lines indicate direct or possible indirect effects, respectively. The black boxes represent CtrA binding sites. (B) The differential spatial distribution of multiple regulatory elements that drive cell-cycle progression are shown. PD, predivisional cell, ST, stalked cell; SW, swarmer cell.

