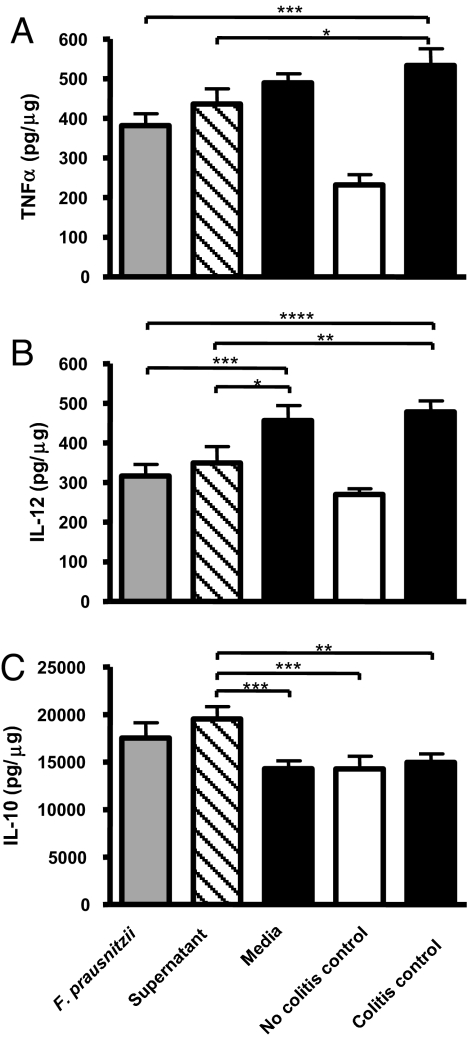
Fig. 5.
Quantification using ELISA of TNF-α (A), IL-12 (B), and IL-10 (C) in colons obtained 48 h after TNBS colitis induction. The values are expressed in pg/μg of total proteins as the mean ± SEM. Different asterisks (*) indicate significant differences (*, P < 0.05; **, P < 0.01; ***, P < 0.003; ****, P < 0.001).

