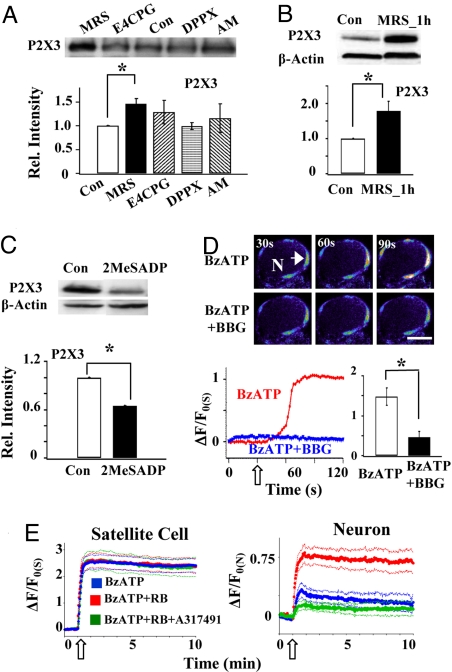
Fig. 2.
Activation of P2Y1Rs inhibits the expression and activity of P2X3Rs. (A) Treating DRGs with the P2Y1R antagonist MRS2179 (60 μM) for 3 h increased the P2X3R expression (1.46 ± 0.11, n = 3, *P < 0.05). Conversely, P2X3R expression was not affected by 3 h of incubation of the group I/II metabotropic glutamate antagonist E4CPBG (1 mM; 1.29 ± 0.25, n = 3, P > 0.05), the adenosine A1 receptor antagonist 1,3-diporpyl-8-phenylxanthine (DPPX, 200 nM; 0.99 ± 0.07, n = 3, P > 0.05) or the cannabinoid CB1 antagonist AM251 (2 μM; 1.16 ± 0.30, n = 3, P > 0.05). (B) MRS2179 (60 μM) could change P2X3R expression within 1 h of its incubation (1.79 ± 0.28, n = 4, P < 0.05). (C) Incubating DRGs with the P2Y1R agonist 2MeSADP (100 μM) reduced the expression of P2X3Rs in DRGs (0.65 ± 0.10, n = 3, *P < 0.05). (D) The P2X7 agonist BzATP (30 μM) increased [Ca2+]i in satellite cells. Pseudocolor images of a DRG neuron (N) with surrounding satellite cells showed a large fluorescence increase in satellite cells following the application of BzATP. The number at the upper left corner in each frame indicates the time at which the image was taken. Below is the time course of relative fluorescence changes in one of the satellite cells (arrow), i.e., (ΔF/Fo(S)) = [(F-Fo)/Fo] × 100 where Fo is the basal fluorescence in the satellite cell before drug application. The empty arrow indicates the starting time of BzATP application. Bar = 20 μm. The bar graph indicates that activation of P2X7Rs by BzATP increased [Ca2+]i in satellite cells, and the increase was inhibited by 20 min preincubation with BBG (1 μM) (BzATP: 148 ± 22%; BzATP + BBG: 46 ± 14%, n = 23, *P < 0.05). (E) BzATP (100 μM) elicited a large ΔF/Fo(S) increase in satellite cells, but a rather small change in ΔF/Fo(N) in neurons. A 1-h preincubation of the DRG with the P2YR antagonist RB (1 μM) did not further increase [Ca2+]i in satellite cells. Conversely, [Ca2+]i in neurons increased significantly in the presence of RB. This large increase in neuronal [Ca2+]i was blocked when the P2X3 antagonist A317491 (60 μM) was applied with BzATP to the DRG, suggesting P2X3Rs mediate the increase. The thick lines are the average [Ca2+]i responses of 10 to 15 neurons or those of 16 to 26 satellite cells. The thin lines represent SEs of the average values. Empty arrows indicate the starting time of drug applications.

