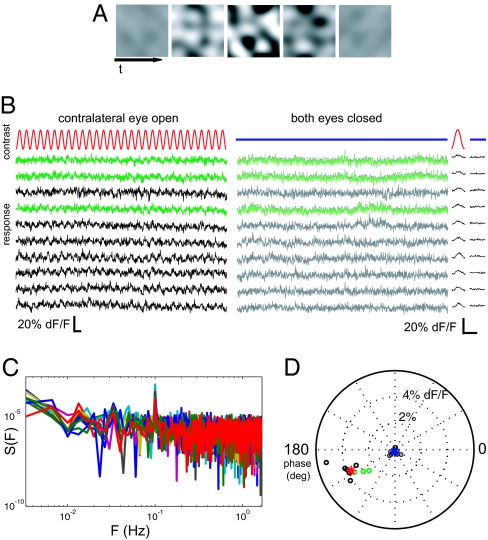
Fig. 2.
Measuring cell responses to monocular visual stimulation. (A) Contrast modulated stochastic noise visual stimulus. A grayscale movie, modulating sinusoidally between zero and maximal contrast with a 10-s period, was presented separately to each eye (Movie S1 (AVI)). The noise stimulus contained spatial and temporal components tailored to the selectivity of mouse primary visual cortical neurons. (B) Example cellular calcium signal traces from 10 simultaneously recorded neurons during 30 cycles of the noise stimulus presented to one eye only (Left), or with both eyes occluded (Right). Recordings from inhibitory neurons are in green. Time average of 30 cycles plotted for each stimulation condition (far right) shows a periodic response to monocular stimulation in all cells. Scale bars are 20 s (Left) and 10 s (Right). (C) Power spectra of responses to contralateral stimulation show a peak at the fundamental frequency of contrast modulation. (D) Responses to visual stimulation are well separated from nonstimulated condition. Shown is a polar plot of the phase and amplitude of the best-fitting sinusoid of period 10 s for each of the cells above in stimulated (open circles) and unstimulated control (filled circles) conditions. Red and blue asterisks indicate the mean response across cells for the stimulated and nonstimulated conditions, respectively. Green circles indicate inhibitory cell responses.

