Fig. 3.
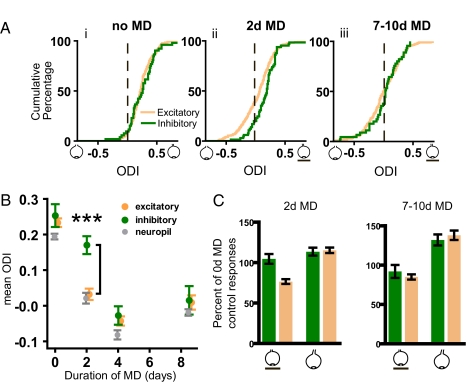
Monocular deprivation affects excitatory cell responses faster than inhibitory cell responses. (A) For each cell, an eye dominance index was computed from the responses to monocular stimulation. The index ranges from −1 for neurons driven exclusively by the ipsilateral eye to +1 for those driven exclusively by the contralateral eye. (i) The ODI distributions of inhibitory and excitatory cells responses are similarly biased toward the contralateral eye (K-S test, D = 0.1356, P = 0.382; nexc = 253, ninh = 52). (ii) After 2 days of monocular visual deprivation (MD) of the contralateral eye, excitatory and inhibitory cell distributions are no longer matched (K-S test, D = 0.246, P = 0.002; nexc = 333, ninh = 71). (iii) After 7–10 days of deprivation, the two populations are matched again (K-S test, D = 0.1605, P = 0.276; nexc = 206, ninh = 45). (B) Effect of length of MD on mean ODI for excitatory and inhibitory cells, as well as for the neuropil. Only at 2 days were the inhibitory and excitatory populations significantly different (Mann–Whitney test, U = 7957, P < 0.0001) as a result of the rapid change in excitatory but not in inhibitory cells. Contamination by neuropil responses cannot account for the delay seen in inhibitory cell plasticity. Error bars reflect standard error of mean. (C) (Left) Comparison of the median responses from excitatory and inhibitory cells after 2 days of MD, each normalized by the median responses from the control group with no MD. The responses of excitatory cells to the deprived eye are selectively reduced, whereas the deprived-eye responses of inhibitory cells and the open-eye responses in inhibitory and excitatory cells are largely unchanged. (Right) After 7–10 d of MD, responses in excitatory cells are similar to those of inhibitory cells, no matter which eye is stimulated. Error bars reflect standard error of the median, obtained by bootstrap estimation.

