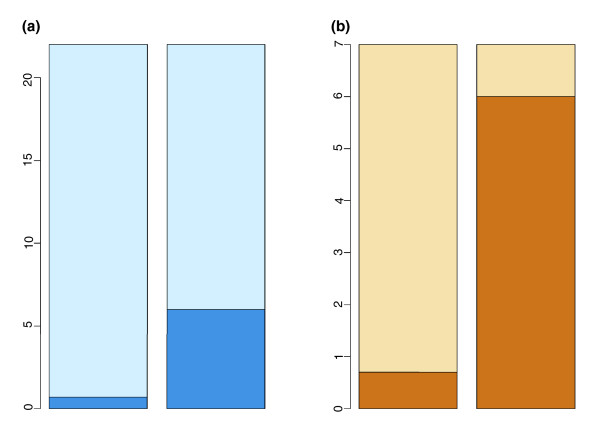
Figure 1.
The proportion of biological processes showing evidence of recent positive selection on the human lineage that is differentially expressed in schizophrenia. The height of the bar represents the number of GO groups showing evidence of recent positive selection on the human lineage; (a) all 22 and (b) the 7 relating to energy metabolism. The darker shade of color represents the number of GO groups differentially expressed in schizophrenia among the 22 or the 7 GO groups (Wilcoxon rank sum test, p < 0.03, FDR = 11%). Left bar, expected by chance; right bar, observed.

