
Figure 2.
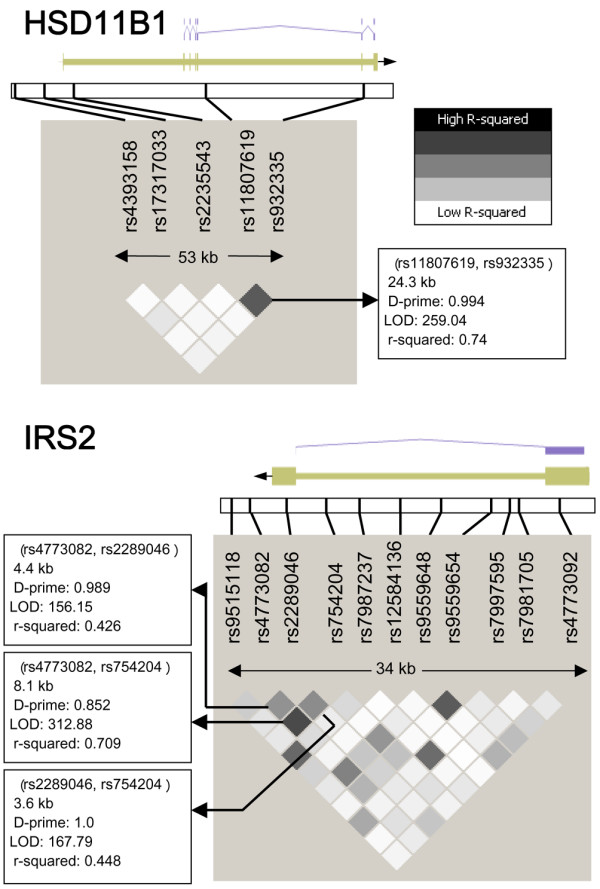
Pattern of linkage disequilibrium for tagging SNPs genotyped in HSD11B1 and IRS2. The gray shaded boxes correspond to the paired r2 between the single nucleotide polymorphisms (SNPs). The associated protein products are also shown.
Official websites use .gov
A
.gov website belongs to an official
government organization in the United States.
Secure .gov websites use HTTPS
A lock (
) or https:// means you've safely
connected to the .gov website. Share sensitive
information only on official, secure websites.
Pattern of linkage disequilibrium for tagging SNPs genotyped in HSD11B1 and IRS2. The gray shaded boxes correspond to the paired r2 between the single nucleotide polymorphisms (SNPs). The associated protein products are also shown.