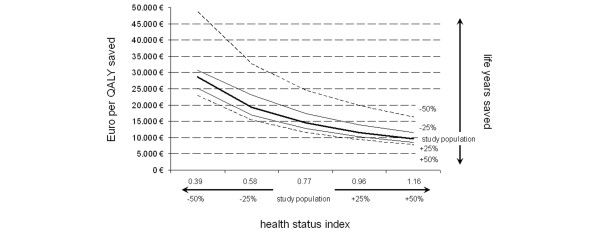
Figure 3.
Two-way sensitivity analysis depicting costs per quality-adjusted life year (QALY) saved considering both an increase and a decrease in health status index 5 years post-intensive care unit of 25% and 50%, respectively (bold solid line). Moreover, the remaining life years were modelled, again considering an increase and a decrease of 25% (fine line) and 50% (dashed line), respectively.

