
Figure 3.
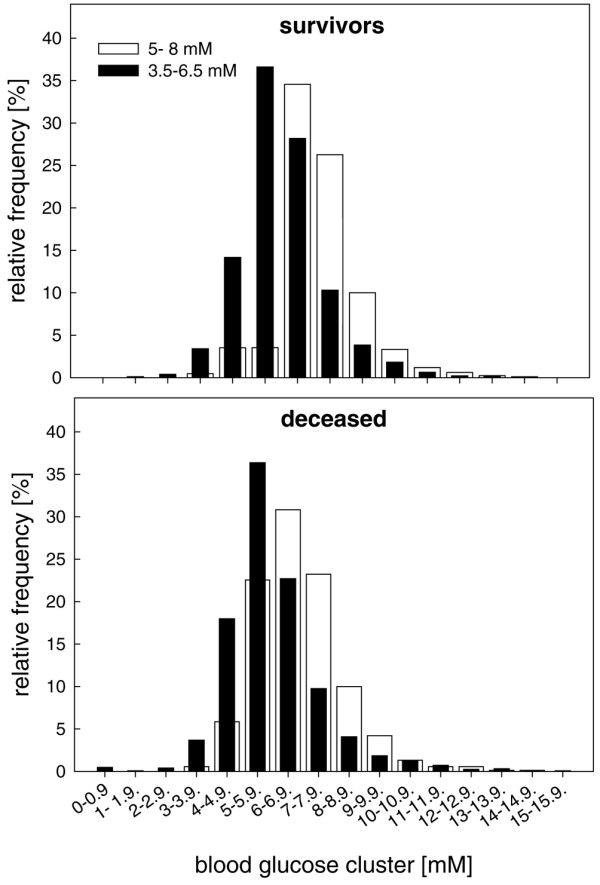
Arterial blood glucose levels. Presented are histograms showing distribution of arterial blood glucose levels within predefined clusters in surviving patients (upper panel) and patients who died (lower panel) treated within the 3.5 to 6.5 mmol/l (black columns) and 5 to 8 mmol/l (white columns) blood glucose targets.