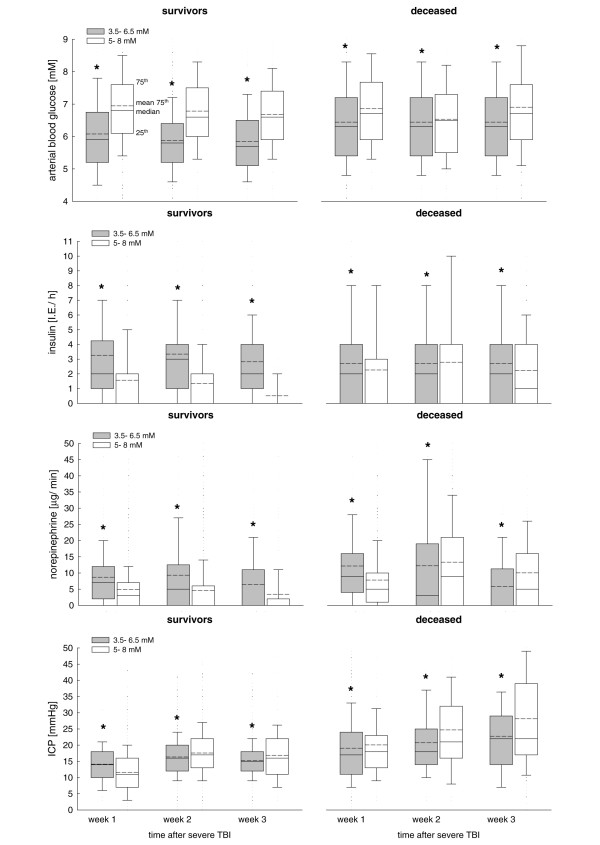
Figure 5.
Changes in arterial blood glucose, insulin and norepinephrine dose, and ICP. Shown are changes in arterial blood glucose, insulin and norepinephrine dose, and intracranial pressure (ICP) in surviving patients and in those who died, within the different blood glucose target groups over time. (a) Arterial blood glucose levels were significanlty decreased in both surviving and deceased patients in the 3.5 to 6.5 group. (b) Insulin requirement was significantly increased in the 3.5 to 6.5 mmol/l group. (c) Within the 3.5 to 6.5 mmol/l group, surviving patients and those who died required significantly greater amounts of norepinephrine. (d) ICP was significantly increased in the 3.5 to 6.5 mmol/l group during the first week in surviving patients, followed by a significant decrease during the subsequent weeks. Patients who died exhibited a significantly increased ICP in the first week, irrespective of blood glucose target. In the third week, however, ICP was significantly increased in the 5 to 8 mmol/l group. *P < 0.05, analysis of variance on ranks.

