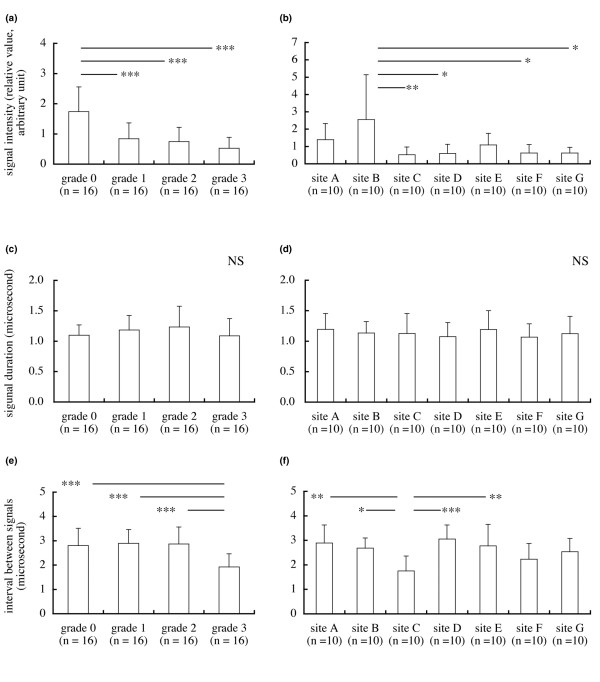
Figure 3.
Signal intensity, echo duration and interval between signals. (a) The signal intensity (a measure of superficial cartilage integrity) of grade 0 cartilage was greater than the intensities of grade 1, grade 2 or grade 3 cartilage (mean and standard deviation). (b) The signal intensity at site B cartilage was significantly greater than the intensities at site C, site D, site F or site G cartilage. (c) No difference in echo duration (a parameter related to the surface irregularity) among the grades. (d) No difference in echo duration among the sites. (e) The interval between signals (that is, time of flight – which is related to thickness and ultrasound speed of cartilage) of grade 3 cartilage was less than the intervals of grade 0, grade 1 or grade 2 cartilage. (f) The interval between signals at site C was less than the intervals at site A, site B, site D or site E. *P < 0.05, **P < 0.01, ***P < 0.001; NS, not significant.

