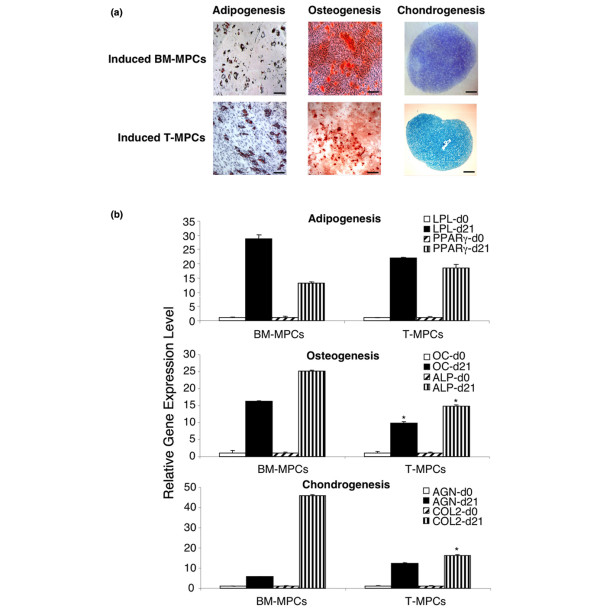
Figure 3.
Histological and real-time reverse transcription-polymerase chain reaction analysis of adipogenic, osteogenic, and chondrogenic differentiation of tonsil-derived mesenchymal progenitor cells (T-MPCs). (a) Histology. Induced bone marrow-derived mesenchymal progenitor cell (BM-MPC) cultures are shown in the top panels; induced T-MPC cultures are shown in the bottom panels. In adipogenesis, the formation of lipid droplets is visualized by staining with Oil red O (bars = 40 μm); in osteogenesis, the matrix mineralization is shown by Alizarin red staining (bars = 40 μm); and in chondrogenesis, the accumulation of sulfated glycosaminoglycan-rich matrix is detected by Alcian blue staining (bars = 300 μm). (b) Gene expression analysis of adipogenic, osteogenic, and chondrogenic differentiation of T-MPCs in comparison with BM-MPCs. Adipogenesis genes are lipoprotein lipase (LPL) and proliferator-activated receptor-gamma (PPARγ), osteogenesis genes are osteocalcin (OC) and alkaline phosphatase (ALP), and chondrogenesis genes are aggrecan (AGN) and collagen type II α1 (COL2). Gene expression analysis was done at the beginning of culture (d0) and at 3 weeks (d21). Expression levels were normalized on the basis of glyceraldehyde 3-phosphate dehydrogenase (GAPDH) expression, and the results are reported as ratios of the marker gene versus GAPDH using the formula 2ΔCT (× 100). Values are mean ± standard deviation (n = 2). *P < 0.05 versus BM-MPCs.

