
Figure 4.
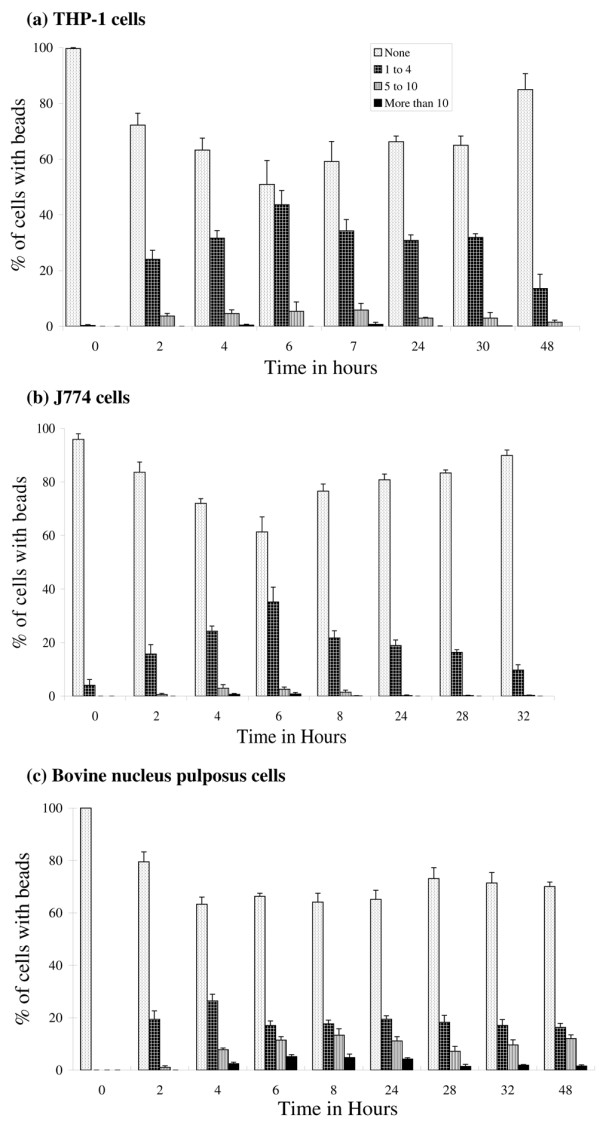
Numbers of beads ingested by cells. Frequency bar chart shows the percentage of cells that had ingested different numbers of latex beads with time: (a) THP-1 cells, (b) J774 cells, and (c) nucleus pulposus cells. Bar indicates standard error (n = 4 cultures for each time point).