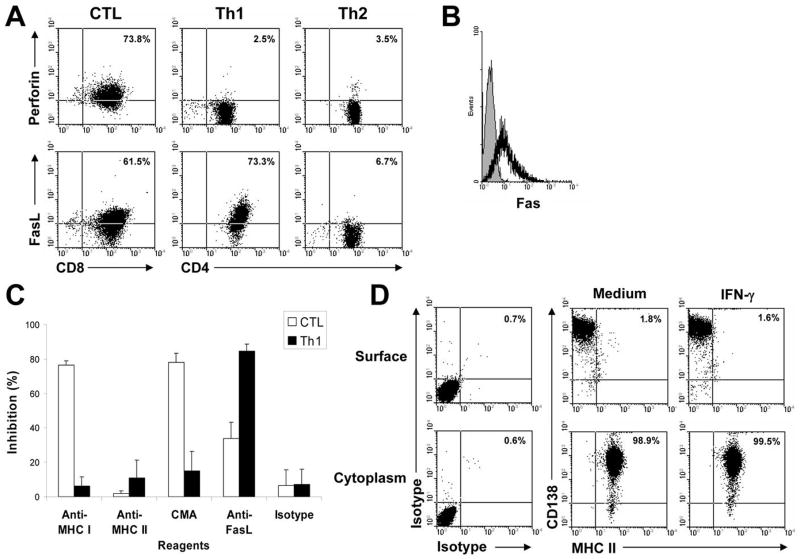
Figure 4. Restriction of the T-cell clone-mediated cytotoxic activity.
A, flow cytometry analysis showing the expression of perforin and FasL on the T-cell clones. Values in each dot plot represent the percentages of CD8+ CTL or CD4+ Th1 or Th2 cells expressing perforin or FasL. B, expression of Fas molecules (solid line) on 5TGM1 myeloma cells. Shaded area represents staining with isotype control. C, Inhibition of T cell-mediated cytotoxicity against 5TGM1 myeloma cells by mAbs (20 g/mL) against MHC class I (Anti-MHC I), MHC class II (Anti-MHC II), or FasL (Anti-FasL), or by the treatment of CMA. Isotypic control IgG (Isotype) served as control. An effector:target (E:T) ratio of 10:1 was used. D, flow cytometry analysis showing the expression of MHC class II on the cell surface, and in the cytoplasm. 5TGM1 myeloma cells were cultured without (medium) or with recombinant murine IFN-γ for 48 hours. Isotypic IgG staining was used as control. Values in each dot plot represent the percentages of CD138+ 5TGM1 myeloma cells expressing MHC class II. Representative results of three independent experiments are shown.

