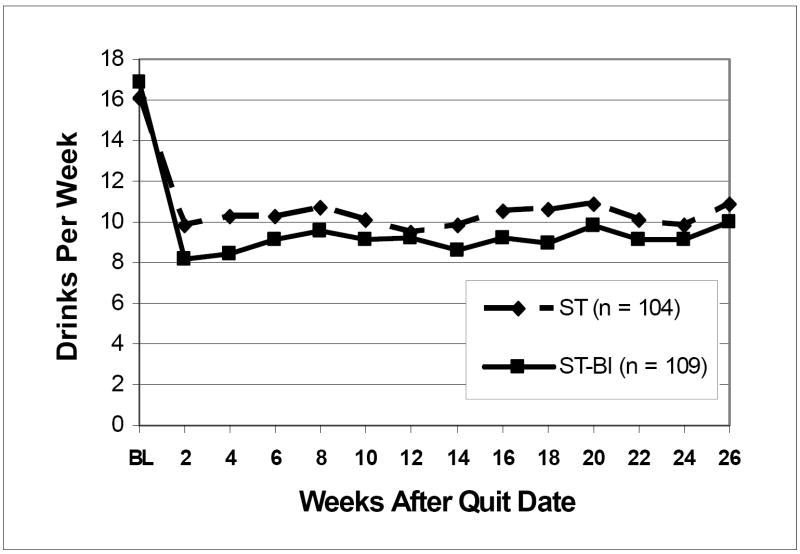
Figure 3.
Mean number of drinks consumed per week over the 26 weeks after quit date. Drinks per week are averaged across thirteen 2-week intervals and graphed by treatment condition. Raw (unadjusted) data are shown. ST = standard smoking cessation treatment. ST-BI = standard smoking cessation that integrates a brief alcohol intervention. Those in ST-BI, compared to those in ST, drank significantly fewer drinks per week, exp(B) = 0.81, 95% CI= 0.67-0.98, p = .027.

