
Figure 2.
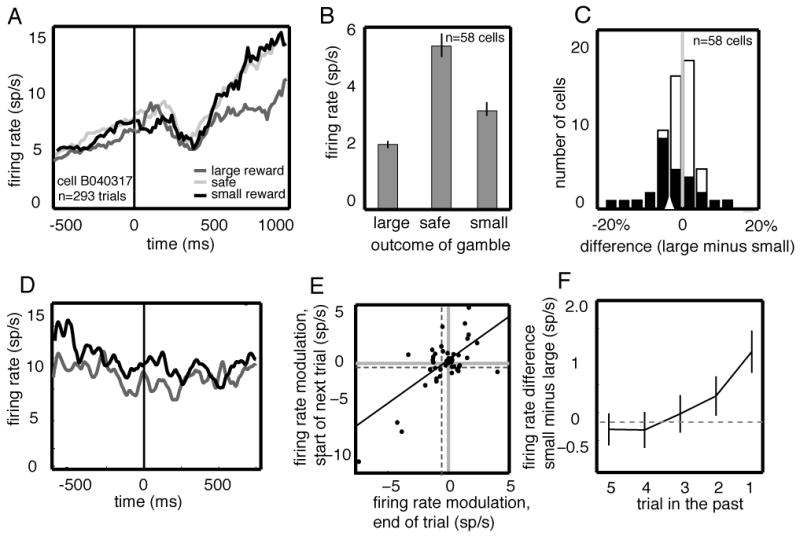
CGp neurons signal reward outcomes in a nonlinear fashion and maintain this information for several trials. A. PSTH for example neuron following reward delivery, aligned to reward offset. Responses were significantly greater following small or medium reward than following large reward. B. Bar graph showing the average response of all neurons in the population to large, medium, and small rewards. Responses are averaged over a 1 second epoch beginning at the time of reward offset (t=0). C. Histogram of reward modulation indices. Index was defined as the response difference to large and small rewards. Negative values correspond to neurons for which small rewards evoked greater responses than larger rewards. Most neurons responded more following small rewards than following large rewards. Black and white bars represent significantly and non-significantly modulated cells, respectively. D. Average responses of example neuron at the beginning of a trial (the 500 ms before the fixation cue that began the trial, t=0) following a trial in which a small (black) or large (dark gray) reward was received. Responses are aligned to the beginning of the trial. E. Scatter plot showing the average firing rate modulation as a function of trial outcome during a 1-sec epoch following reward on a given trial (x-axis) and a 0.5 sec epoch following acquisition of fixation on the subsequent trial (y-axis) for each neuron in the population. Firing rates were correlated in these two epochs, and the average size of the outcome modulation immediately following the gamble (vertical dashed line) was greater than the average size of the outcome modulation on the subsequent trial (horizontal dashed line). F. Average effect of reward outcome on neuronal activity up to 5 trials in the future.