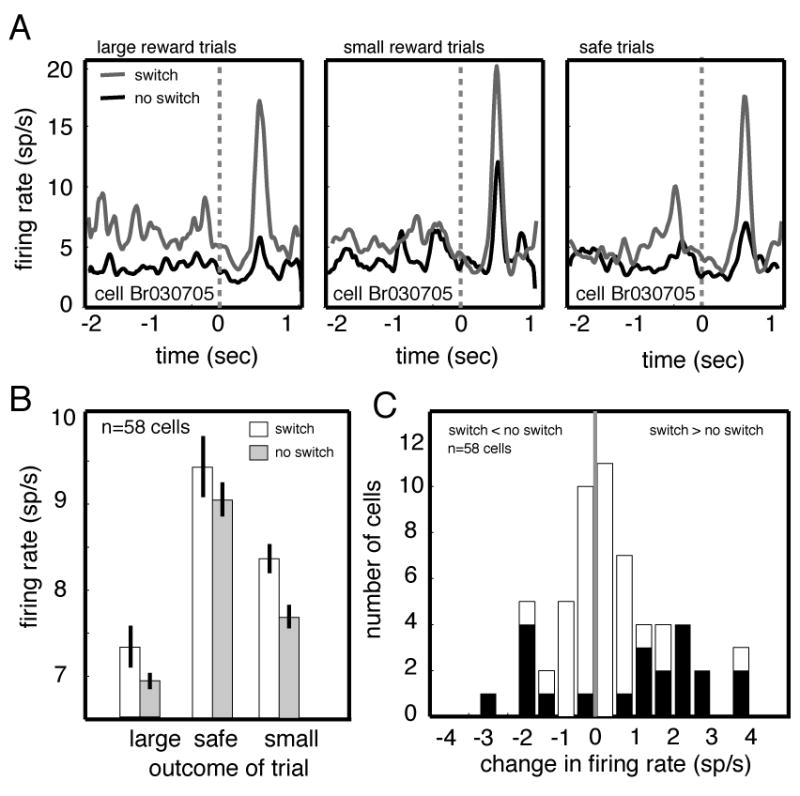
Figure 3.

CGp neurons signal subsequent changes in choice behavior. A. Responses of a single neuron on trials immediately preceding a switch in choice behavior (gray line) and no switch in behavior (black line) for different reward outcomes. PSTHs are aligned to the time at which the gamble is resolved (indicated as time zero on the graph). B. Bar graph showing the average firing rate during a 1 sec epoch beginning at reward offset for all neurons in the population on trials that preceded switches (white bars) and that did not (gray bars). Responses were greater preceding a switch, although this effect was only significant following choices of the risky option. C. Histogram of firing rate modulations associated with switching behavior (neurons with significant modulations are indicated by black bars).
