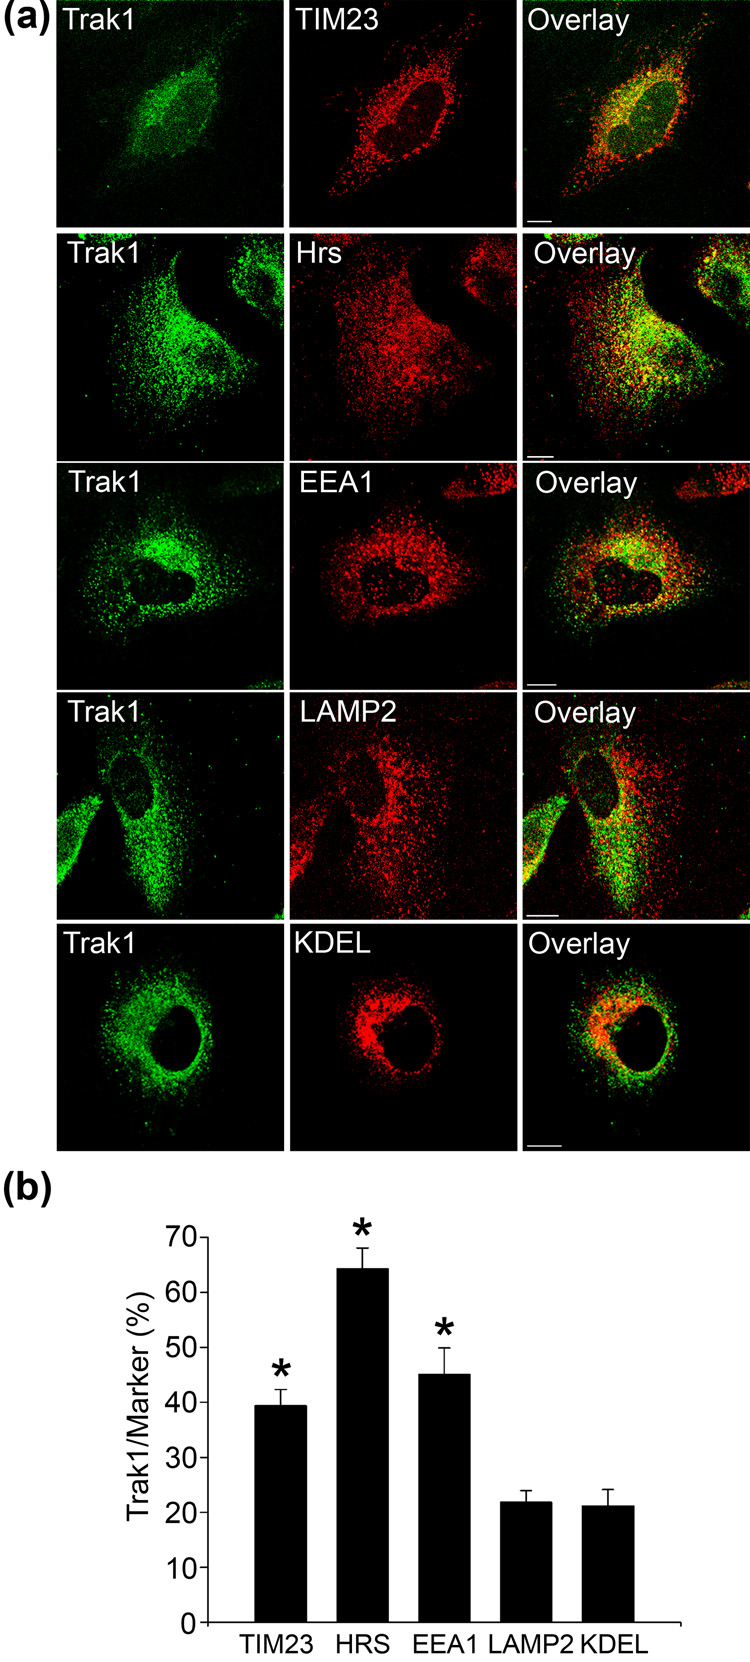
Fig. 2. Endogenous localization of Trak1.
(a) HeLa cells were double-immunostained using anti-Trak1 antibody and anti-TIM23, anti-Hrs, anti-EEA1, anti-LAMP2, and anti-KDEL antibodies. Bar,10µm. (b) Quantification of Trak1 localization in HeLa cells. Images were processed and analyzed as described in Methods. The percentage of Trak1 that overlaps with the indicated marker proteins is presented as the mean ± s.e.m. The asterisks indicate a statistically significant difference (p < 0.05) from the KDEL results. Data are the result of 3–5 separate experiments.

