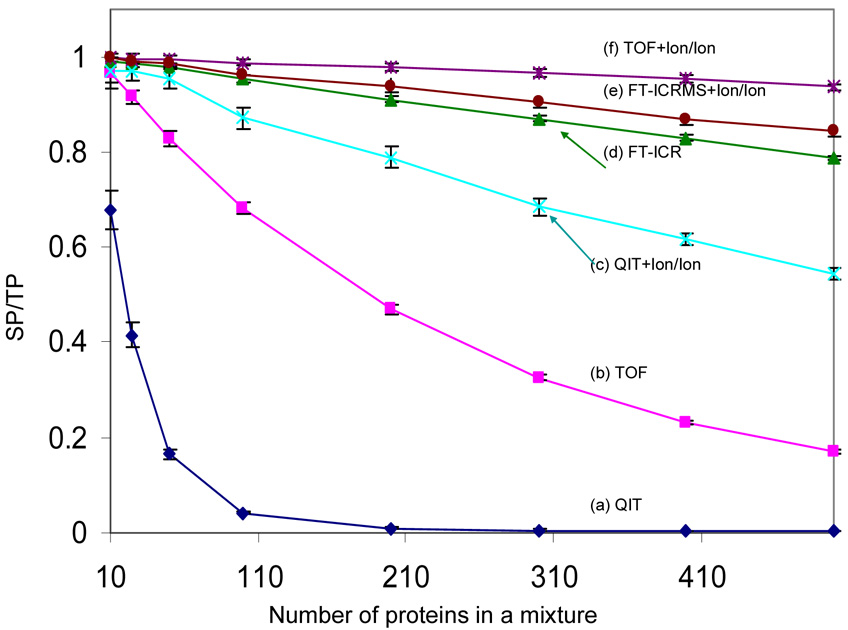
Figure 3.
Comparison of the SP/TP (ratio of resolved peaks to the total number of predicted peaks) from six mass spectrometry based approaches: (a) QIT, (b) TOF, (c) QIT coupled with ion/ion reaction, (d) FT-ICRMS, (e) FT-ICRMS coupled with ion/ion reaction and (f) TOF coupled with ion/ion reaction (ion/ion reaction time: 500 ms), in the context of the ESI simulation. Each data point is the average of 20 simulations and the error bars reflect the standard deviation.

