
Fig. 1. RhoA and ROCK activity affects L. monocytogenes invasion.
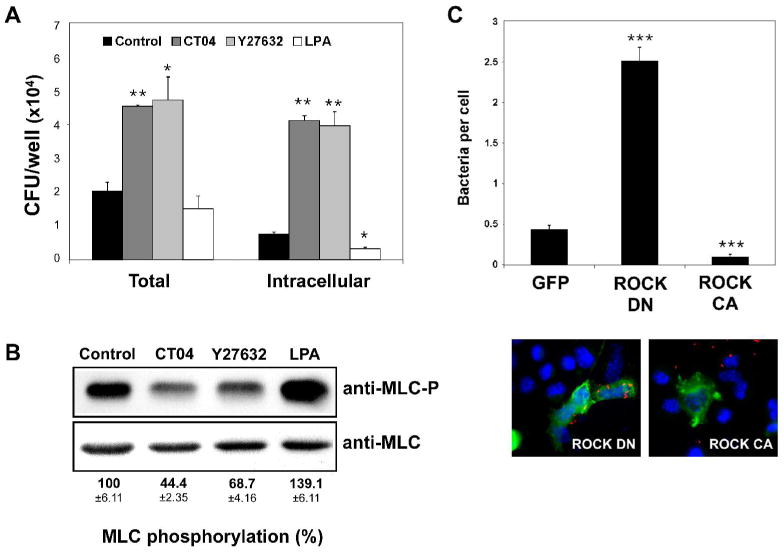
A. L2 cells were treated for 5 h with 2 μg/ml CT04 or for 30 min with 10 μM Y27632, 10 μM LPA or with DMSO (control) prior to infection with wild-type L. monocytogenes (10403S). At 1 h post-infection, cell-associated (total) bacteria were quantified as described in Experimental Procedures. For determination of intracellular bacteria, samples were washed and subsequently incubated with medium containing 50 μg/ml gentamicin for an additional 1 h to kill extracellular bacteria prior to quantitation of intracellular bacteria. Data represents the mean colony forming units (CFU) and standard deviations (s.d.) of one of three experiments performed in triplicate with similar results. * p < 0.05, ** p < 0.01 compared to control.
B. Western blot analysis of L2 cell extracts treated as in (A) with 2 μg/ml CT04, 10 μM Y27632, 10 μM LPA or DMSO (control). Phospho-myosin light chain antibody (MLC-P, upper panel) or myosin light chain 2 antibody (MLC, lower panel) was used. Shown is a representative autoradiograph. MLC phosphorylation (MLC-P) was quantified by densitometry as described in Experimental Procedures and normalized against total MLC protein. Numerical values indicate the means ±s.d. of the percentage of MLC phosphorylation relative to control samples of three independent experiments.
C. L2 cells seeded on glass coverslips were transfected with myc-tagged ROCK constructs or the respective control vector expressing GFP. ROCK DN denotes dominant negative ROCK, whereas ROCK CA denotes constitutively active ROCK. Twenty-four hours post-transfection, cells were infected with wild-type L. monocytogenes for 1 h. Coverslips were washed several times to remove unbound bacteria and then analyzed by immunofluorescence microscopy. Transfected cells were identified by detection of Myc-tag expression (green). Cell-associated bacteria (red) were quantified by counting 100 transfected cells for each sample. Cell nuclei are shown in blue. The upper graph indicates the means ±s.d. of bacteria associated per transfected L2 cell (n=3). *** p < 0.001 compared to GFP.