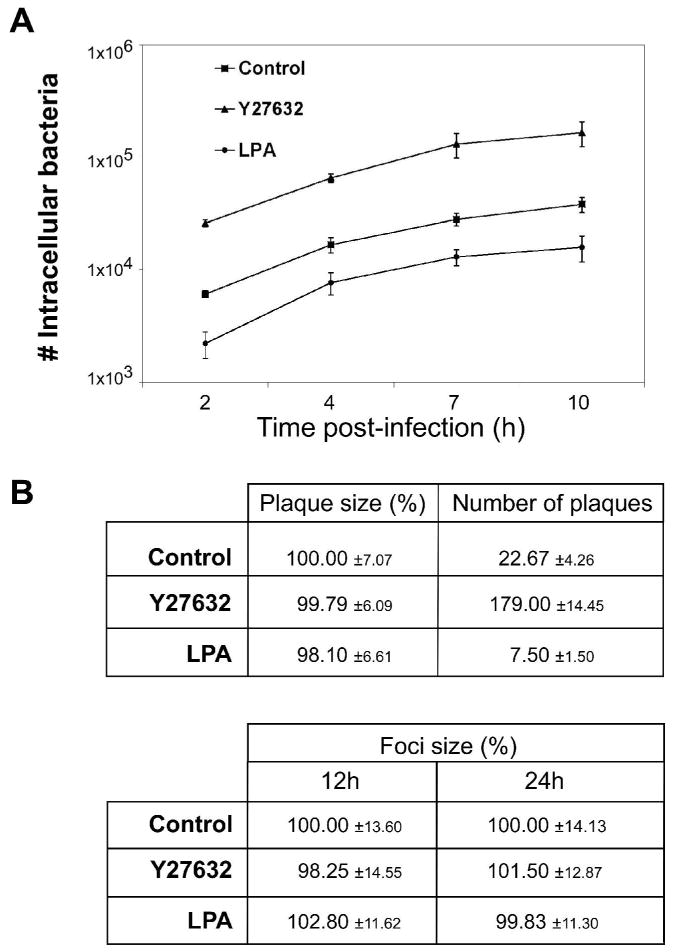
Fig. 2. ROCK activity does not affect intracellular growth or cell-to-cell-spread of L. monocytogenes.

A. Intracellular growth of L. monocytogenes in L2 cells. L2 cell monolayers seeded onto glass coverslips were treated with 10 μM Y27632, 10 μM LPA or DMSO (control) and infected with wild-type L. monocytogenes (10403S). At 1 h post-infection, coverslips were washed and medium containing 10 μM Y27632, 10 μM LPA, or DMSO and gentamicin was added and replaced at 4 h and 7 h post-infection. At the indicated times post-infection, coverslips were removed and the number of intracellular bacteria determined as described in Experimental Procedures. Data shown represents the means ±s.d. of one of three independent experiments performed in triplicate with similar results.
B. Cell-to-cell spread in L2 fibroblasts. For plaque formation assays, L2 cell monolayers seeded in 6-well dishes were treated with 10 μM Y27632, 10 μM LPA, or DMSO (control). Wild-type L. monocytogenes (10403S) were added to monolayers for 1 h. The infected monolayers were washed with PBS, and a medium-agarose overlay containing 10 μM Y27632, 10 μM LPA, or DMSO and gentamicin was added to kill extracellular bacteria. Intracellular growth and cell-to-cell spread of bacteria were visualized after 72 h by the formation of clearing zones (plaques) within the L2 monolayers. The number of plaques/well was determined and the diameters of 10 plaques/sample were measured. Data represent the mean percent diameter of plaques ±s.d. relative to the control and the mean number of plaques formed/well ±s.d. Data are from three independent experiments performed in duplicate. For microscopy analysis of foci of infection, L2 cell monolayers seeded onto glass coverslips were treated with 10 μM Y27632, 10 μM LPA, or DMSO (control) and infected with GFP-expressing wild-type L. monocytogenes (10403S). At 1 h post-infection, coverslips were washed and medium containing 10 μM Y27632, 10 μM LPA, or DMSO and gentamicin was added and replaced at 4 h, 8 h, and 12 h post-infection. At 12 h and 24 h post-infection, coverslips were fixed, nuclei stained and analyzed by fluorescence microscopy. The diameters of 15 foci/sample were measured. Data represent the mean percent diameter of foci ±s.d. relative to the control. Data are from three independent experiments.
