Figure 1.
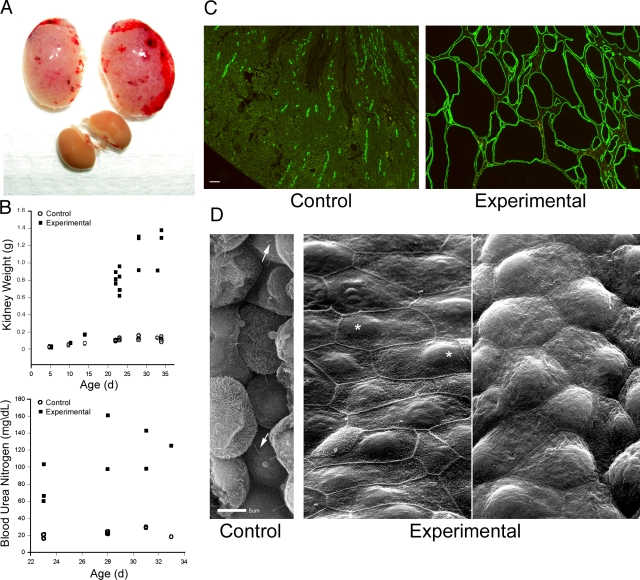
Deletion of Ift20 in mouse kidney. (A) Gross morphology of experimental kidneys (top pair) and control kidneys at p23. (B) Mean weight of kidneys and blood urea nitrogen levels of control and experimental animals. Each symbol represents one animal. The symbols at 5 and 10 d were slightly offset. (C) Adult (p23) kidneys stained with DBA (green). (D) Scanning EM images of control and experimental kidneys. Arrows indicate cilia and asterisks indicate nuclei. Bars: (C) 100 μm; (D) 5 μm.

