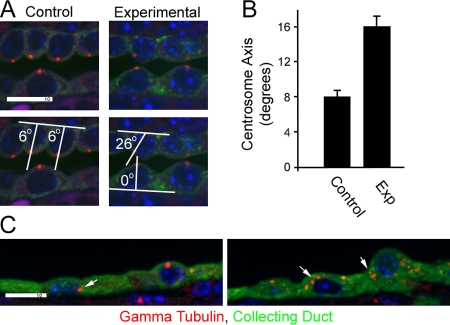
Figure 4.
Centrosome defects. (A) In control p5 kidneys, centrosomes (γ-tubulin, red) are typically found at the center of the apical surface of collecting duct cells, whereas the position in experimental animals is more variable. The position was quantified by measuring the angle between a line along the basal surface of the cell and a line drawn between the centrosome and the center of the cell at the basal surface. The cell center was defined by the center of the nucleus. The bottom two panels illustrate this measurement. Images are maximum projections of four confocal z images taken 0.5 μm apart. (B) Quantification of the centrosome axis. n = 100. Error bars indicate SEM. (C) Two examples of the unusual localization of centrosomes (arrows) that can be found in highly cystic kidneys. Bars, 10 μm.

