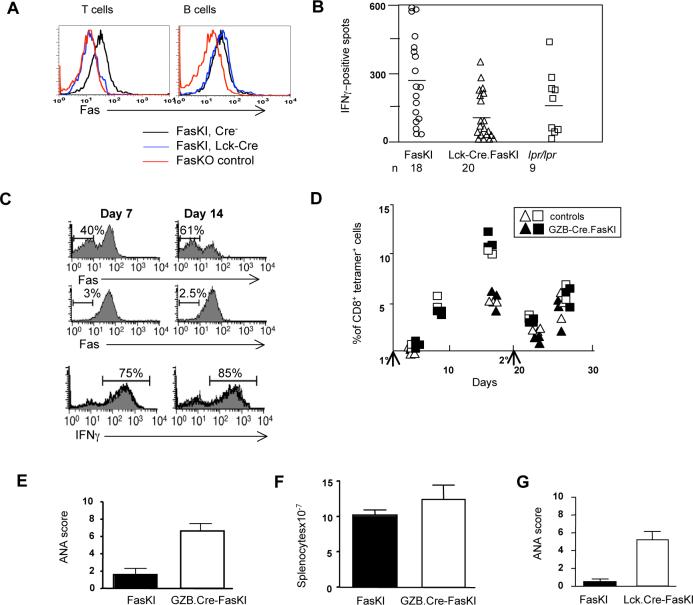
Figure 6. Loss of Fas by T cells does not regulate T cell responses to strong antigens, but leads to systemic autoimmunity.
A. Flow cytometric analysis shows the specificity of Fas deletion by Cre in Lck-Cre.FasKI mice. T and B cells from Fas knock-out (FasKO) animals were used as negative controls.
B. Lck-Cre.FasKI, Cre-negative FasKI and B6lpr/lpr mice were immunized in the footpads with 50μg OVA mixed 1:1 with Complete Freund's Adjuvant. Regional lymph node cells were stimulated 11 days later in vitro overnight with OVA, and IFNγ secretion was detected by ELISPOT. Ordinate: mean number of dots (from triplicate wells) is shown adjusted to the frequency of CD4+ T cells determined by flow cytometric analysis on the day of the experiment. Symbols show individual mice.
C. GZB-Cre.FasKI.OT-1 transgenic Ly5.2 marked T cells and Ly5.1-marked OT-1 T cells were co-injected in Ly5.1+Ly5.2+ mice and their fate was followed after infection with Lm-OVA. Details of experimental design are shown in Supplemental Figure 7. T cells from GZB-Cre.FasKI.OT-1 donors (top panels) show significant loss of Fas 1−2 weeks after activation with OVA expressed by bacteria compared to OT-1 T cells (middle panels). The survival of activated cells from GZB-Cre.FasKI.OT-1 and wild-type OT-1 mice did not differ: Absolute numbers of OT-1vs GZB-Cre.FasKI.OT-1 T cells were 1.0×10⁶ vs. 1.2×10⁶ at day 7 and 1.7×10⁵ vs. 1.6×10⁵ on day 14, respectively. In addition, similar %s of IFNγ producing cells were found in both populations (bottom panels). Representative plots are shown. Bold line –GZB-Cre.FasKI.OT-1 T cells; shaded histogram – OT-1 T cells from the same adoptive host gated using Ly5 alleles.
D. Primary (1°) and secondary (2°) responses to minor histocompatibility antigen H60 are not different in GZB-Cre.FasKI mice compared to Cre-negative littermates. Note that there is no primary response at day 4 after immunization, thus only recall responses are compared at day 4 after secondary i.p. immunization with 2×10⁷ C.B10 splenocytes. Ordinate: % of CD8+ T cells in PBL that are H60-tetramer-positive. Primary and secondary immunizations are marked by arrows. Data shown for individual mice traced in two separate experiments (triangles and squares, respectively). Black symbols – GZB-Cre.FasKI; open symbols – control mice.
E. ANA formation in GZB-Cre.FasKI mice. Sera from GZB-Cre.FasKI mice (n=11) or Cre-negative littermates (n=9) 6 mo of age or older were used at 1:100 dilution. Relative scores were 2.2± 0.4 and 6.3±0.8 in Cre− and Cre+ FasKI mice respectively.
F. Splenic cellularity in 8−10 mo old GZB-Cre. FasKI mice was not significantly greater than in control Cre-negative littermates. (p=0.215, 9 control and 19 Cre+ mice were used).
G. Lck-Cre.FasKI mice produce ANA. Sera obtained from individual 6+ mo old female mice (6 FasKI and 13 Lck-Cre.FasKI animals) were tested at 1:100 dilution. Relative scores were 0.5± 0.3 and 5.3±0.9 in Cre− and Cre+ FasKI mice respectively.

