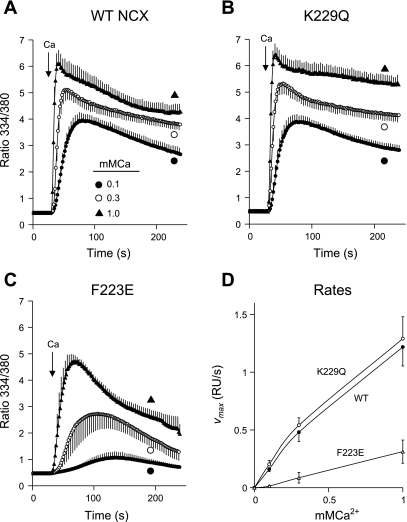
Fig. 2.
Ca2+ uptake by cells expressing WT, F223E, and K229Q exchangers in 140 mM Na+. Cells expressing WT NCX (A), K229Q mutant (B), or F223E mutant (C) were pretreated with ATP + thapsigargin and incubated for 8 min before assay in Na-PSS containing 1 μg/ml gramicidin; NCX activity was initiated by application of 0.1, 0.3, or 1 mM CaCl2 in Na-PSS. D: maximal rates of Ca2+ uptake [Vmax, expressed as ratio units (RU)/s] determined from slopes of individual cells for each coverslip and then averaged. Values are means, with SE for every other data point; n = 4 coverslips for all except WT at 0.1 mM Ca2+, where n = 5. Experiments were conducted at room temperature.

