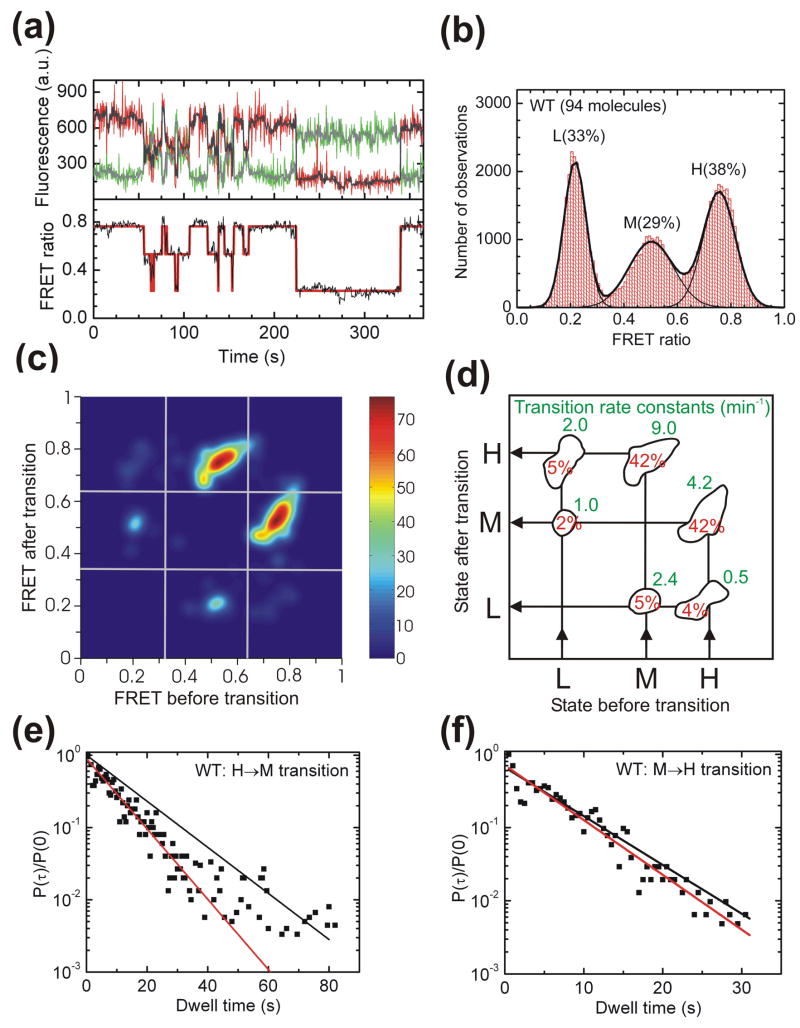
Fig. 2.
Single molecule FRET analysis of the WT VS ribozyme. (a) Representative FRET time trace of a WT molecule. The raw Cy3 donor and Cy5 acceptor fluorescence signals are green and red, respectively. Superimposed in gray are the data after applying a non-linear filter as described.38 The FRET ratio (black trace below) is calculated from the filtered data as IA/(IA + ID) and reveals three distinct states in Hidden Markov modeling (HMM, red line). (b) An aggregate FRET histogram of 94 WT molecules shows Gaussian distributions for three states with FRET values of ~0.76 (H), ~0.50 (M) and ~0.22 (L) and the indicated abundances. (c) Transition density contour map from HMM analysis54 of all transitions for 77 well defined WT molecules. (d) Relative contributions and mean rate constants of the transitions illustrated in panel C. (e, f) The normalized probability densities40 of all dwell times preceding an H→M (E) and M→H (F) transition are fit with single exponential decay functions (red lines) that are compared to decay functions (black lines) using the rate constant from the HMM analysis in panel D.

