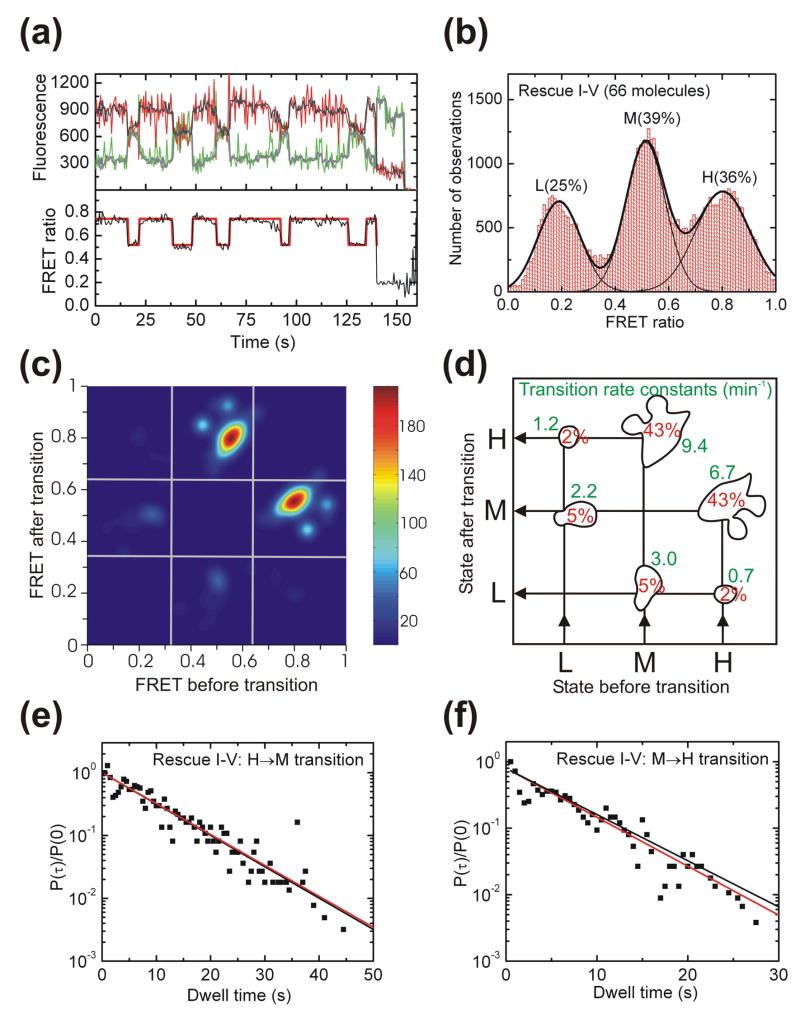
Fig. 4.
Single molecule FRET analysis of the Rescue I-V ribozyme. (a) Representative FRET time trace of a Rescue I-V molecule. The raw Cy3 donor and Cy5 acceptor fluorescence signals are green and red, respectively. Superimposed in gray are the data after applying a non-linear filter as described.38 The FRET ratio (black trace below) is calculated from the filtered data as IA/(IA + ID) and reveals three distinct states in Hidden Markov modeling (HMM, red line). (b) An aggregate FRET histogram of 66 Rescue I-V molecules shows Gaussian distributions for three states with FRET values of ~0.80 (H), ~0.51 (M) and ~0.19 (L) and the indicated abundances. (c) Transition density contour map from HMM analysis54 of all transitions for 62 well defined Rescue I-V molecules. (d) Relative contributions and mean rate constants of the transitions illustrated in panel C. (e, f) The normalized probability densities40 of all dwell times preceding an H→M (E) and M→H (F) transition are fit with single exponential decay functions (red lines) that are compared to decay functions (black lines) using the rate constant from the HMM analysis in panel D.

