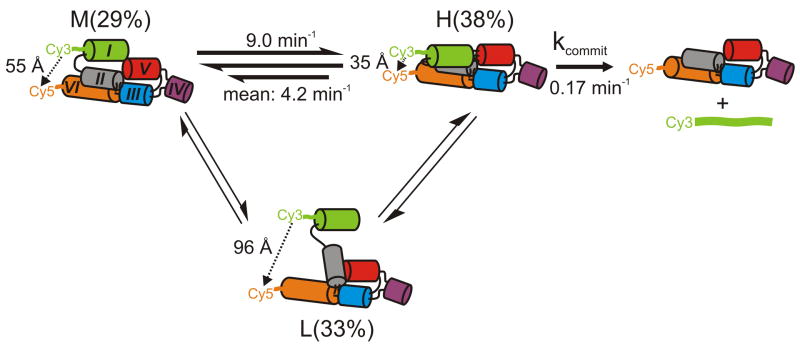
Fig. 6.
Structural and kinetic model of the reaction pathway of the WT VS ribozyme. The helix colors match those in Fig. 1b. The reported H to M transition rate constant is the mean value obtained from the HMM analysis; the dual arrows represent heterogeneity (either static, i.e., never-changing or possibly dynamic, i.e., time-dependent in nature) in this transition as illustrated in Fig. 2e. The fluorophore distances and relative abundances of the H, M and L states were obtained from single molecule FRET, while kcommit was modeled. L states, while often long-lived, are only infrequently accessed by a sub-population of molecules (static heterogeneity, thinner arrows).

