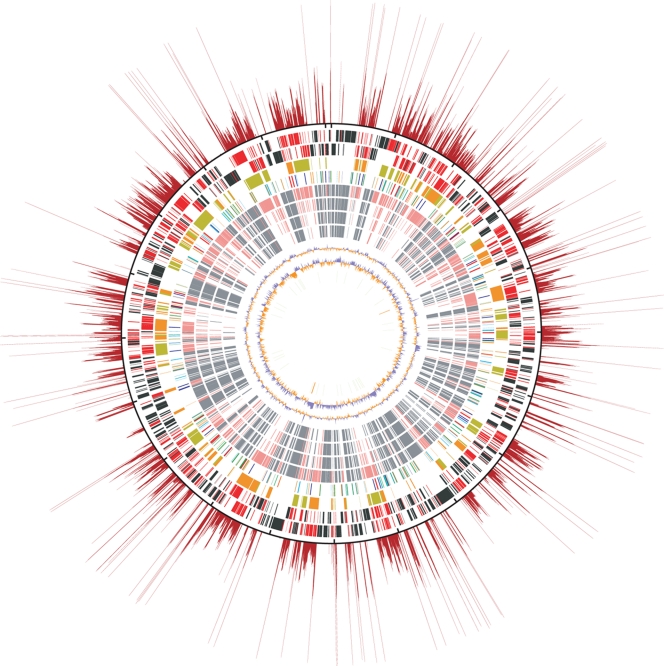
Figure 1.
Structural features of the O. tsutsugamushi genome. The putative origin of replication is located at the top. The outermost red rays show the repetition rates of each chromosomal region. The repetition rates were determined by sliding window analysis (window size, 100 bp; step size, 3 bp). The total number of 100-bp windows retrieved from the entire genome sequence was 669 663. All the 100-bp window sequences were searched for homologous regions using the BLASTN program. The repetition rate was defined as the total number of BLASTN hits (threshold: >120 BLASTN similarity score, excluding hits to their own sequences). The longest ray corresponds to the 108-folds repetition. The outermost black circle is a scale where the short dashes mark 100-kb intervals. The circles inside the scale show, from the outside in: (i) genes on the forward strand (singleton genes in black and repeated genes in red), (ii) genes on the reverse strand (singletons in black and repeated genes in red), (iii) OtAGE sequences on the forward (orange) and reverse (greenish yellow) strands, (iv) transposable elements (ISOt1 and mISOt1, green; ISOt2 and mISOt2, light blue; ISOt3, blue; ISOt4 and mISOt4, orange; ISOt5, dark blue; GIIOt1, red), (v) singleton genes (gray) and repeated genes (light red) whose homologues are present in R. bellii, (vi) R. felis, (vii) R. conorii, (viii) R. prowazekii, (ix) G + C content [%: blue, higher than the average of the whole genome (30.5%); orange, lower than the average], (x) GC skew [(G–C)/(G + C): blue, ≥0; orange, <0], and (xi) tRNA (green) and rRNA (orange) genes.

