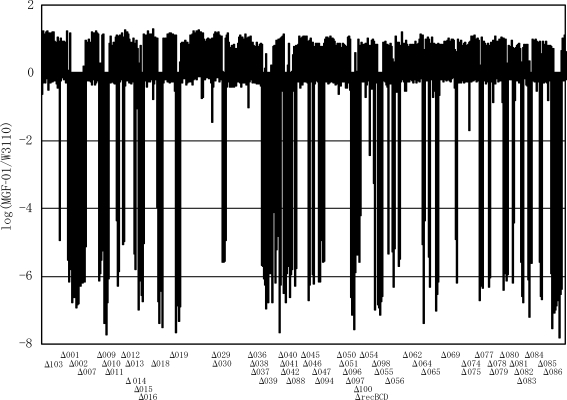
Figure 2.
Map of deletions detected in MGF-01 on microarray analysis. Each bar represents the log ratio of normalized signal intensities (MGF-01 ORF signal/W3110 ORF signal). Deleted regions were determined when the signal ratios were below –1.8. The signal ratios were plotted against ORF locations of JW0001 to JW4366. The corresponding deletion identification numbers are indicated at the bottom of the figure.

