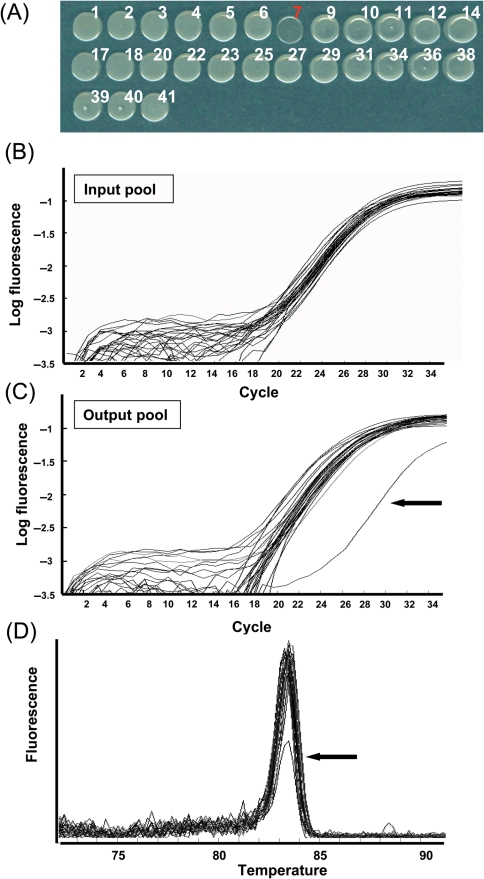
Figure 3.
Test experiments for identifying a growth-deficient mutant within a pool of mutants. (A) Growth of 27-tagged mutants on rich TY medium. Same concentration of individual mutants was spotted on TY broth medium. Mutant 07T2d09, integrated with pTnMod-OΩ-Tag7, exhibited reduced growth compared with other mutants. Quantitation of PCR amplifications of the input pool (B) and output pool (C). X and Y axes show the number of PCR cycles and log fluorescence of PCR products, respectively. Arrow in C indicates the quantitative curve from PCR reaction with Tag7 primer. The amounts of amplified products in all reactions of input pool were similar (ranging from 0.37- to 1.7-fold compare with average). In output pool, the amount of amplified products of all but tag7 were similar to that of input pool (ranging from 0.25- to 1.6-fold compared with that of input pool), whereas the amount in reaction of tag7 primer was 90-fold lower than that of input pool. (D) Melting curve of the output pool showing the change in fluorescence from 72°C to 91°C. All melting curves are shown as relative intensities among all reactions. Arrow in D indicates the melting curve of PCR reaction with Tag7 primer.

