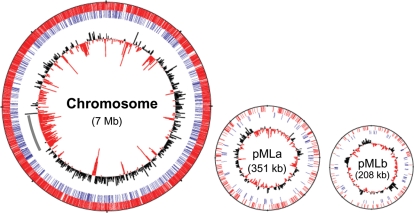
Figure 5.
Distribution of transposon insertions in the M. loti genome. The bars in the first and second circles show the position of transposon insertion sites within ORFs (red bars) and within intergenic regions (blue bars), respectively. The innermost circles represent the average G+C content calculated in each 10 kb. A positive deviation in G+C content from the average (62.7%) is shown by black bars pointing outward and a negative deviation by red bars pointing inward. Grey bar in chromosome indicates the region of symbiosis island.

