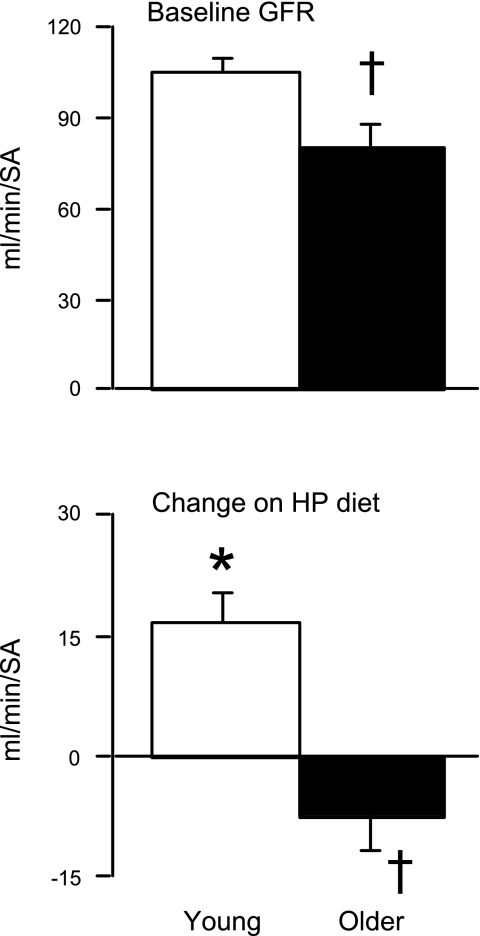
Fig. 2.
Glomerular filtration rate (GFR). Data are means ± SE. GFR by renal clearance of iothalamate. Top: GFR measured during the adequate-protein diet (baseline). Bottom: change in GFR on the HP vs. the adequate-protein diet. *P < 0.05 vs. UP diet within age group; †P < 0.05 vs. younger participants on the same diet.

