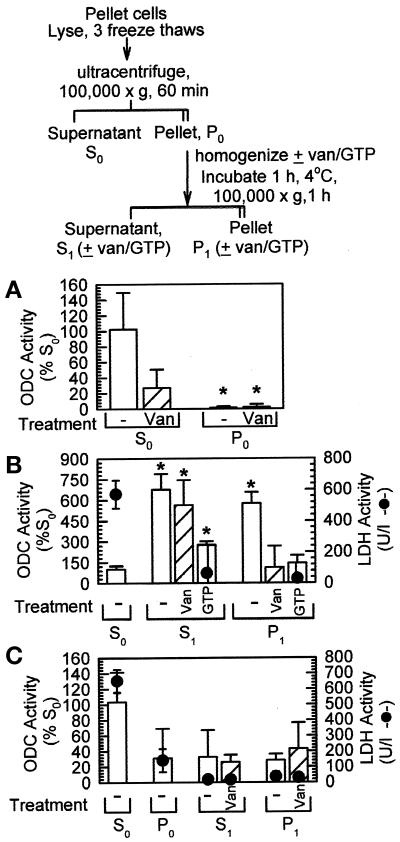
Figure 8.
Fractionation of ODC activity by sequential homogenizations and centrifugations. (A) NHEK were lysed, and soluble protein was separated from insoluble protein by ultracentrifugation. The pellet was homogenized, and ODC activity (vertical bars) was measured (±2 mM orthovanadate [Van or van], a phosphatase inhibitor) using the 14CO2-release assay. ODC activity was significantly greater in the supernatant (S0) fractions than in the pellet (P0) fractions. (B) The insoluble materials were again separated from the soluble materials after the P0 homogenization (see flow chart at the top). From three to seven times the activity of the S0 supernatant was measured in the S1 supernatant; the P1 pellet also showed considerable ODC activity. (C) In fibroblasts, ODC activity was greatest in the S0 fraction, with all other manipulations resulting in activities approximately equivalent to that of the fibroblast P0 pellet. Filled circles in B and C indicate LDH activity measured in parallel, indicating that soluble proteins were contained in the S0 fractions. Data in A and B represent independent measurements of 3–10 individual plates from a single experiment; data in C represent the average of 4 individual plates from each of two independent experiments (n = 4–8). The results in A and B were reproduced in greater than two repeats of the individual parts of the experiments; for C, an additional experiment yielded similar results. *p < 0.05 (as compared with S0 fractions).

