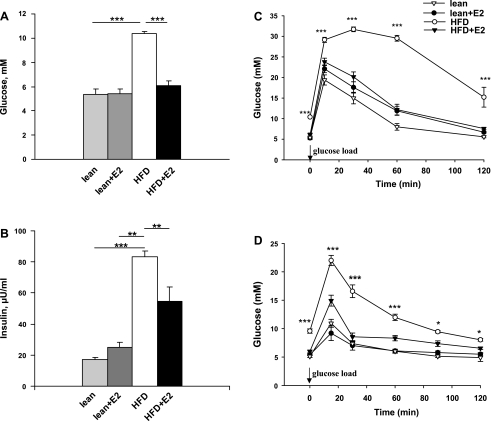
Fig. 3.
Blood glucose concentrations, plasma insulin levels, glucose tolerance, and insulin sensitivity in lean and HFD mice treated with E2. A: fasting blood glucose levels. Data are presented as means ± SE; n = 5–6. ***P < 0.001 for lean and lean + E2 vs. HFD mice and for HFD vs. HFD + E2 mice. B: plasma insulin levels. Data are presented as means ± SE; n = 5–6. ***P < 0.001 for lean. **P < 0.01 for lean + E2 vs. HFD mice, and **P < 0.01 for HFD vs. HFD + E2 mice. C: intraperitoneal glucose tolerance test (IPGTT) was performed in overnight-fasted mice. Blood glucose levels were measured before and after glucose load (2 g/kg body wt ip) at the indicated time points. Data are presented as means ± SE; n = 5–6. ***P < 0.001 vs. vehicle-treated HFD mice. D: intraperitoneal insulin tolerance test (IPITT) in overnight-fasted mice. Animals were first injected with insulin (0.25 U/kg body wt ip) and 10 min later with glucose (1 g/kg body wt ip). Blood glucose concentrations were measured at basal conditions and at 15, 30, 60, 90, and 120 min after glucose load. Data are presented as means ± SE; n = 5–6. *P < 0.05 and ***P < 0.001 vs. vehicle-treated HFD mice.

