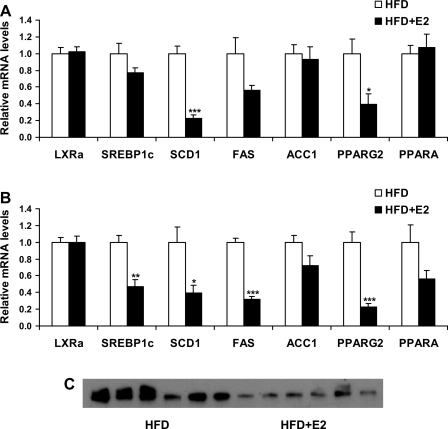
Fig. 6.
mRNA levels of genes involved in lipid metabolism in liver (A) and WAT (B) of HFD mice after E2 treatment. Data are presented as means ± SE. *P < 0.05, **P < 0.01, and ***P < 0.001 vs. vehicle-treated HFD mice. C: fatty acid synthase (FAS) protein levels in WAT of vehicle and E2-treated HFD mice; n = 6.

