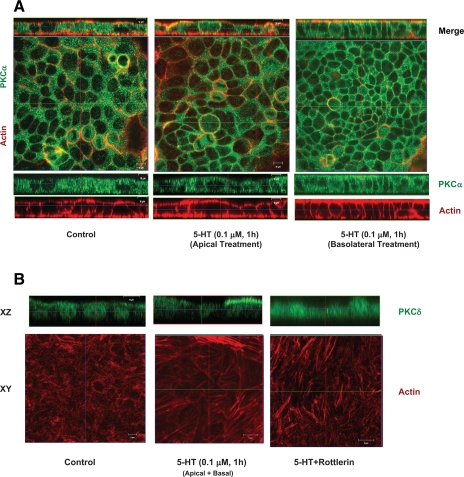
Fig. 6.
Activation of PKCα and PKCδ by 5-HT. A: Caco-2 cells grown on filter inserts were treated with 5-HT (0.1 μM) from either the apical side or the basolateral side followed by staining with phalloidin (red) and PKCα (green). Horizontal (x-y) and vertical (x-z) sections show mostly cytoplasmic staining of PKCα in the control cells. 5-HT treatment from both apical and basolateral sides resulted in translocation of PKCα from cytoplasm to both apical and basolateral membranes colocalizing with actin. Scale bars represent 10 μm. B: Caco-2 cells grown on filter inserts were pretreated with specific PKCδ inhibitor (rottlerin) and then treated with 5-HT (0.1 μM) both from the apical and basolateral sides followed by staining with phalloidin actin (red) and PKCδ (green) (B). Horizontal (x-y) images show basal stress fibers in control and 5-HT-treated cells in the absence or presence of rottlerin. The x-z sections show corresponding translocation of PKCδ upon activation. Although most of the staining of PKCδ is noted in the nuclear region in control cells, upon activation by 5-HT, PKCδ is seen translocated preferentially to the apical membranes. However, 5-HT-mediated induction of basal stress fibers remained unaltered in the presence of rottlerin. Scale bars represent 10 μm.

