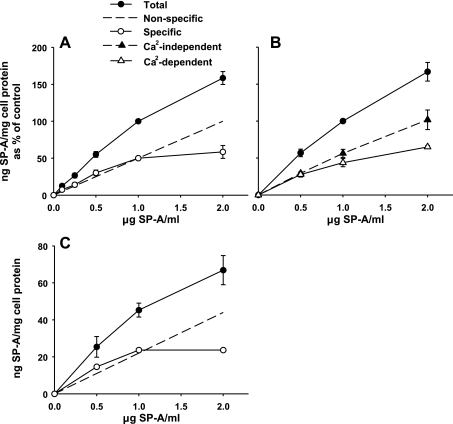
Fig. 6.
Binding characteristics of SP-A to type II pneumocytes and A549 cells. Increasing concentrations of 125I-SP-A were incubated at 4°C, 1 h. The cells were harvested with 2 N NaOH. A: type II cells. The total binding data of SP-A to type II cells (closed circles) at SP-A concentrations from 0.1 to 2 μg SP-A/ml are replotted from Fig. 5A. The specific binding (open circles) was determined by the slope-peeling method (16) where nonspecific portion of the binding curve (long, dashed line) is subtracted from the total binding curve. Data are the means ± SE of 3–8 experiments performed in duplicate or triplicate. B: type II cells. Binding was performed in HBSS with (total binding, closed circles) or without calcium (Ca2-independent, closed triangles). The calcium-dependent binding (open triangles) was determined by subtraction of the total binding from the calcium-independent binding. The data are the ng SP-A/mg cell protein expressed as a percentage of the binding at 1 μg SP-A/ml. 100% = 68.9 ± 18.9 ng SP-A/mg cell protein (mean ± SE, n = 3). C: A549 cells. Binding was performed in MEM. Total binding (closed circles) was measured. Specific binding (open circles) was determined by the slope-peeling method (16) as described in A. Data are ng SP-A/mg cell protein (means ± SE of 3 experiments performed in duplicate).

