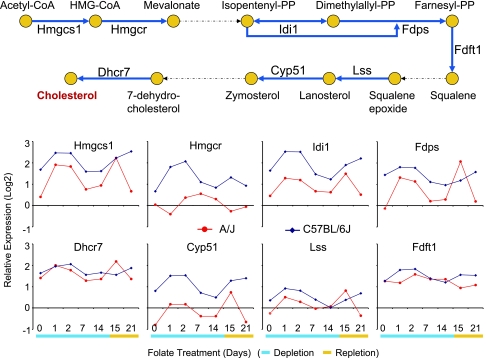
Fig. 4.
Expression profiles of genes involved in cholesterol biosynthesis (GO: 0006695). Relative expression changes from the Universal Mouse Reference RNA (Stratagene) are represented in log2 scale. Red lines indicate A/J and blue lines indicate C57BL/6J profiles. Genes with significant expression changes that showed interaction effects involving strain and folate perturbation after fixed model ANOVA at P = 0.05 (Bonferroni correction) were Hmgcs1, Hmgcr, Idi1, Fdps, and Dhcr7.

