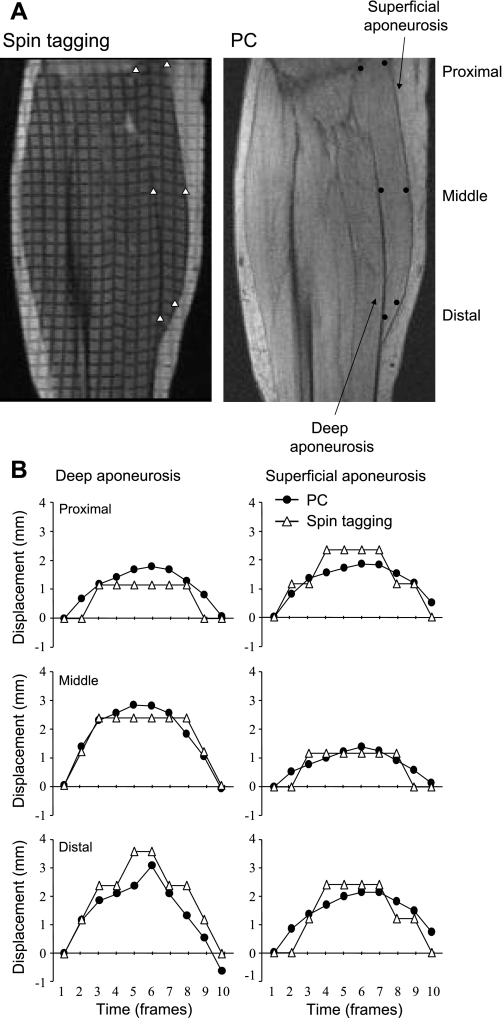
Fig. 2.
Validation of displacement as determined from PC MRI by comparison with spin-tag experiment. A: representative oblique-sagittal spin-tagging and PC images during phase 6, which correspond to the peak torque. ROIs are prescribed graphically along both the superficial and deep aponeuroses. B: displacement at 3 different points along the superficial and deep aponeuroses during the first 10 phases is compared between the PC and spin-tagged data. The single-pixel resolution of the spin-tag data results in steps in the displacement curves, whereas the subpixel resolution of the PC imaging provides smoother curves. The displacement measurements show good correlation (r = 0.89 for superficial aponeurosis and r = 0.89 for deep aponeurosis).

