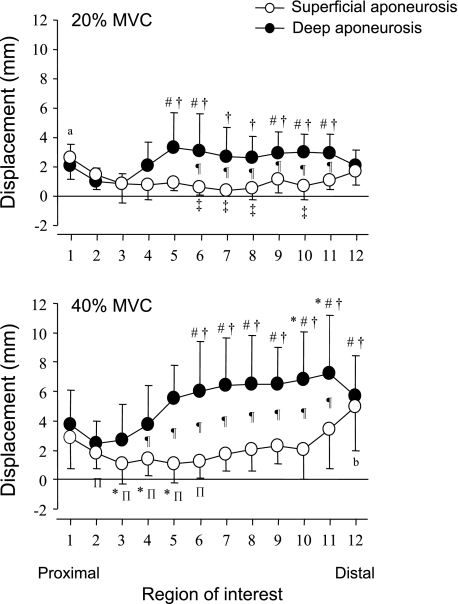
Fig. 3.
Displacement distribution along the superficial and deep aponeuroses. Average displacement distribution along the superficial and deep aponeuroses during 20% (top) and 40% (bottom) MVC from 8 subjects is shown. All conventions are the same as in Fig 2D. Values are means ± SD. *P < 0.05 vs. ROI 1; #P < 0.05 vs. ROI 2; †P < 0.05 vs. ROI 3; ΠP < 0.05 vs. ROI 11; ‡P < 0.05 vs. ROI 12; aP < 0.05 vs. from ROI 2 to ROI 8; bP < 0.05 vs. from ROI 1 to ROI 10; ¶P < 0.05, 20% vs. 40% MVC.

