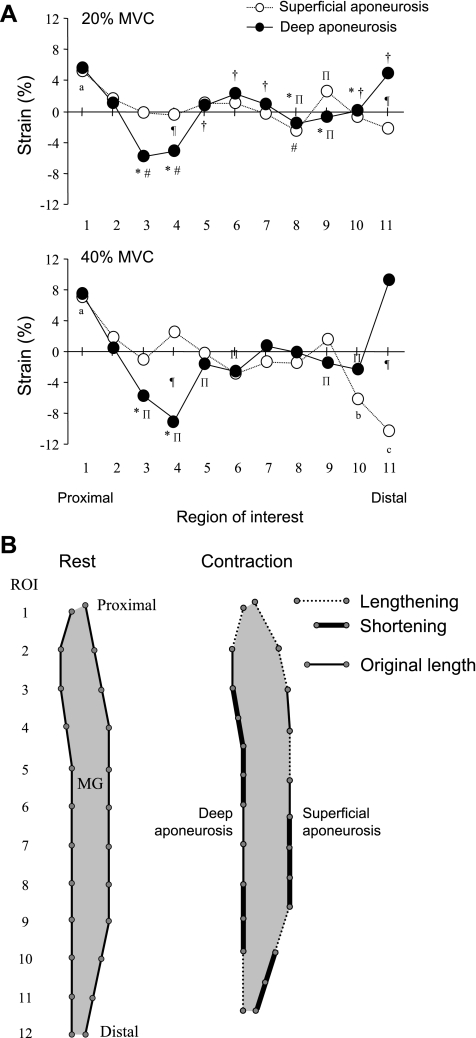
Fig. 4.
Strain distribution along the superficial and deep aponeuroses. A: average strain distribution along the superficial and deep aponeuroses during 20% (top) and 40% (bottom) MVC from 8 subjects. Positive and negative strain indicate lengthening and shortening, respectively. Values are means. *P < 0.05 vs. ROI 1; #P < 0.05 vs. ROI 2; †P < 0.05 vs. ROI 3; ΠP < 0.05 vs. ROI 11; aP < 0.05 vs. from ROI 3 to ROIs 8, 10, and 11; bP < 0.05 vs. ROIs 2, 4, and 10; cP < 0.05 vs. ROIs 2-9; ¶P < 0.05, 20% vs. 40% MVC. B: model of strain distribution along the proximal-distal axis of both aponeuroses. This model resulted from the strain during 40% MVC. Dashed lines indicate location of aponeurosis lengthening, and thick solid lines indicate location of aponeurosis shortening. Thin solid lines are the original length of the aponeurosis, i.e., where strain is undetectable.

