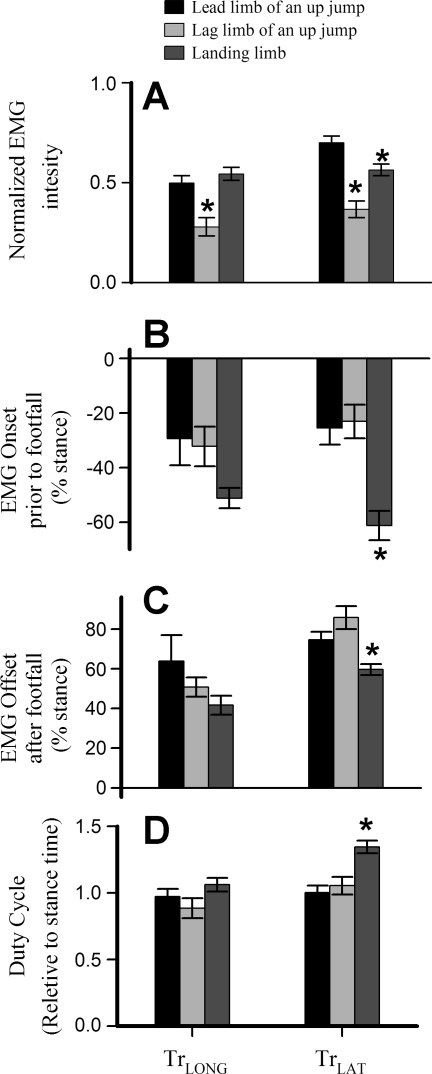
Fig. 5.
Histogram showing means (±SE) across the 4 individual goats for electromyogram (EMG; A) intensity, EMG onset (B), and offset times (as percent of stance and relative to the time of foot on; C), and EMG duty cycle (EMG duration/stance duration; D). *Significant difference among jump types in Tukey's HSD post hoc tests with a starting α of 0.05. In both TrLAT and TrLONG, EMG intensity was greater in lead jumps than in lag jumps, but intensity during landing was also greater than in the lag limb, despite a lower elbow moment (Fig. 4B).

