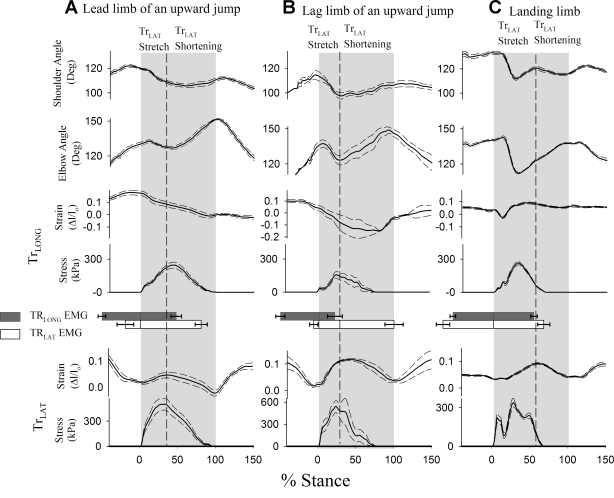
Fig. 6.
Mean profiles (solid lines) ± standard error (dashed lines) across trials for lead limb up jump (A), lag limb up jump (B); and a forelimb landing from a down jump (C), showing temporal patterns of shoulder angle, elbow angle, and fascicle strain and stress in the TrLONG and TrLAT muscle heads, as a percentage of stance in a 45-kg goat. The number of trials included in each graph is given in Table 3. Gray areas indicate stance time, and dashed lines indicate peak stretch in the TrLAT, which was concurrent with peak elbow flexion, except when the forelimb was used to land from a downward jump.

