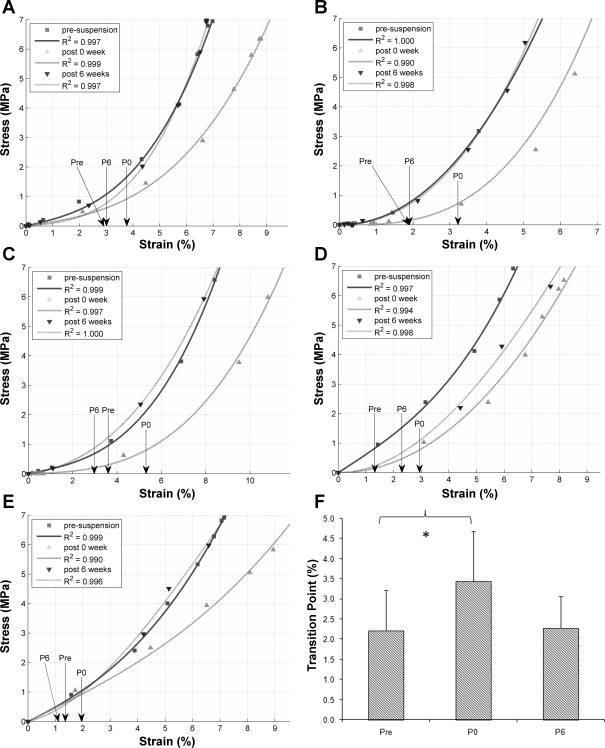
Fig. 4.
A–E: stress-strain relationship of Achilles tendon at presuspension (Pre), at P0, and after 6 wk of physical rehabilitation (P6) for each subject. Arrow, transition point at each period. Quality of each cubic fit with respect to experimental data is denoted with the correlation coefficient value. F: average tendon transition point at Pre, P0, and P6. *P < 0.05, Pre vs. P0.

