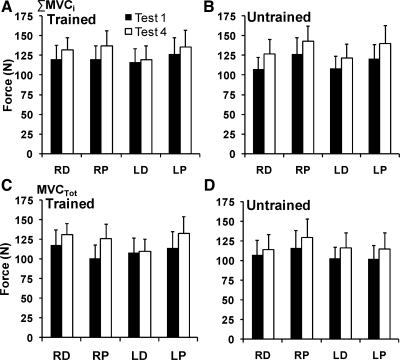
Fig. 4.
Total force produced before (test 1) and after (test 4) training at the trained and untrained distal (D) and proximal (P) sites of the left (L) and right (R) hands, averaged across subjects with standard error bars for maximal individual finger force (ΣMVC1) (A: trained sites; B: untrained sites) and maximal total force in the four-finger task (MVCTOT) (C: trained sites; D: untrained sites). The filled bars represent the pretraining testing session, and the open bars show the posttraining session.

