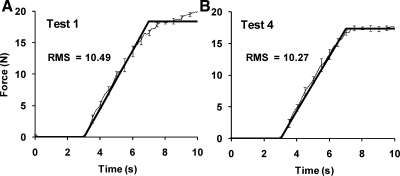
Fig. 6.
The average performance of a representative subject in the ramp task when producing total force at the proximal site of the right hand before training (test 1; A) and after training (test 4; B) with standard error bars. Thick lines represent the task template, and the thin lines show the average performance. The RMS values computed over the whole ramp were 10.49 and 10.27 N at test 1 and test 4, respectively.

